


Line plots
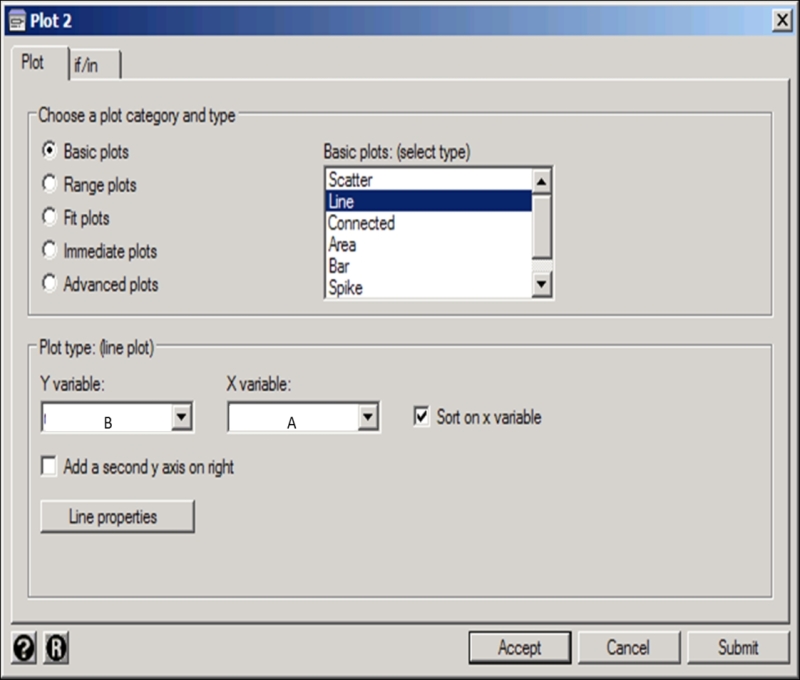
Line plots follow a methodology similar to that of scatter plots. The difference is that you need to select the Line type of graph from the window shown in the following screenshot:

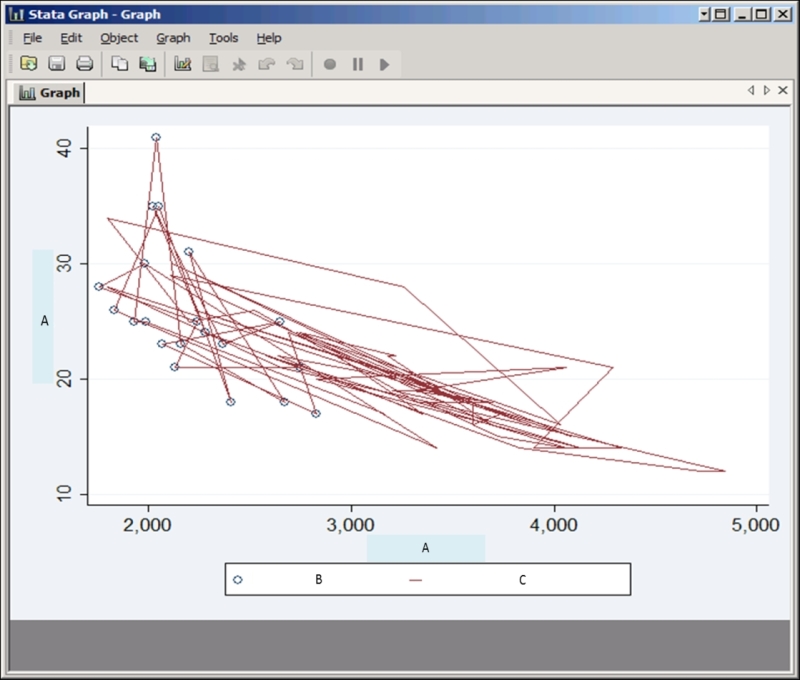
The output is shown as follows:
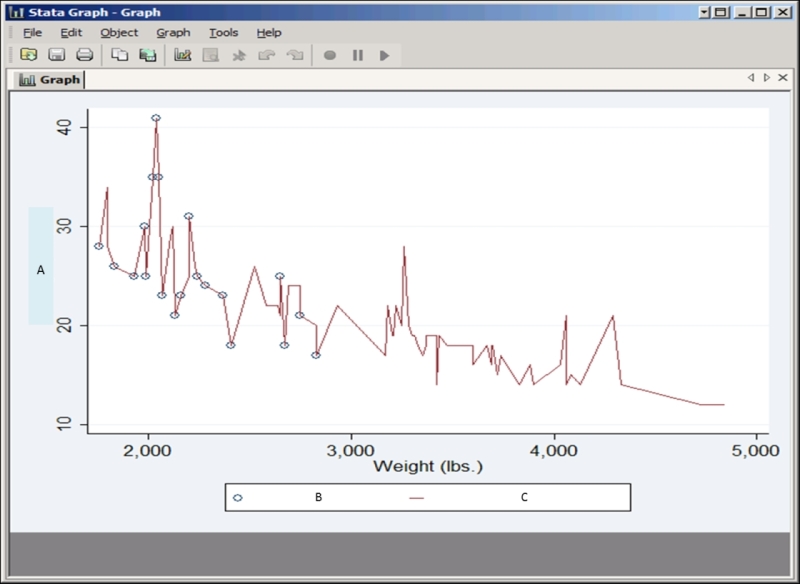
You can also sort the graph on the variable that is input to the X axis. The procedure to sort the graph by the X axis variable in order to find better patterns is shown as follows:
Here is the output, which looks drastically different from the first graph and shows you completely different patterns:
You can also change the line properties of the line graph shown in the preceding screenshot:
Click on Line properties and select the Pattern option.
Select Dash from the list of drop-down options for the pattern box.
Here are a few screenshots that show you how to perform this operation:

Here is how the graph is prepared:


