Search icon CANCEL
Subscription
0
Cart icon
Your Cart (0 item)
Close icon
You have no products in your basket yet
Save more on your purchases! discount-offer-chevron-icon
Savings automatically calculated. No voucher code required.
Arrow left icon
Explore Products
Best Sellers
New Releases
Books
Videos
Audiobooks
Learning Hub
Free Learning
Arrow right icon
Arrow up icon
GO TO TOP
scikit-learn Cookbook , Second Edition

You're reading from   scikit-learn Cookbook , Second Edition Over 80 recipes for machine learning in Python with scikit-learn

Arrow left icon
Product type Paperback
Published in Nov 2017
Publisher Packt
ISBN-13 9781787286382
Length 374 pages
Edition 2nd Edition
Languages
Arrow right icon
Authors (2):
Arrow left icon
Trent Hauck Trent Hauck
Author Profile Icon Trent Hauck
Trent Hauck
Julian Avila Julian Avila
Author Profile Icon Julian Avila
Julian Avila
Arrow right icon
View More author details
Toc

Table of Contents (13) Chapters Close

Preface 1. High-Performance Machine Learning – NumPy FREE CHAPTER 2. Pre-Model Workflow and Pre-Processing 3. Dimensionality Reduction 4. Linear Models with scikit-learn 5. Linear Models – Logistic Regression 6. Building Models with Distance Metrics 7. Cross-Validation and Post-Model Workflow 8. Support Vector Machines 9. Tree Algorithms and Ensembles 10. Text and Multiclass Classification with scikit-learn 11. Neural Networks 12. Create a Simple Estimator

Viewing the iris dataset with Pandas

In this recipe we will use the handy pandas data analysis library to view and visualize the iris dataset. It contains the notion o, a dataframe which might be familiar to you if you use the language R's dataframe.

How to do it...

You can view the iris dataset with Pandas, a library built on top of NumPy:

  1. Create a dataframe with the observation variables iris.data, and column names columns, as arguments:
import pandas as pd
iris_df = pd.DataFrame(iris.data, columns = iris.feature_names)

The dataframe is more user-friendly than the NumPy array.

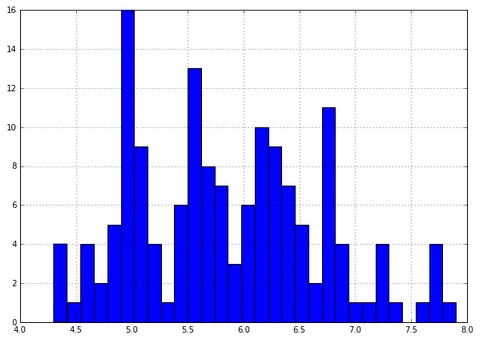
  1. Look at a quick histogram of the values in the dataframe for sepal length:
iris_df['sepal length (cm)'].hist(bins=30)
  1. You can also color the histogram by the target variable:
for class_number in np.unique(iris.target):
plt.figure(1)
iris_df['sepal length (cm)'].iloc[np.where(iris.target == class_number)[0]].hist(bins=30)
  1. Here, iterate through the target numbers for each flower and draw a color histogram for each. Consider this line:
np.where(iris.target== class_number)[0]

It finds the NumPy index location for each class of flower:
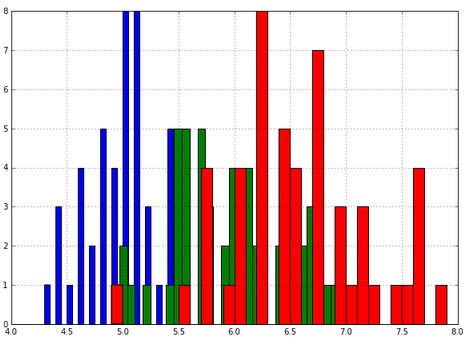
Observe that the histograms overlap. This encourages us to model the three histograms as three normal distributions. This is possible in a machine learning manner if we model the training data only as three normal distributions, not the whole set. Then we use the test set to test the three normal distribution models we just made up. Finally, we test the accuracy of our predictions on the test set.

How it works...

The dataframe data object is a 2D NumPy array with column names and row names. In data science, the fundamental data object looks like a 2D table, possibly because of SQL's long history. NumPy allows for 3D arrays, cubes, 4D arrays, and so on. These also come up often.

You have been reading a chapter from
scikit-learn Cookbook , Second Edition - Second Edition
Published in: Nov 2017
Publisher: Packt
ISBN-13: 9781787286382
Register for a free Packt account to unlock a world of extra content!
A free Packt account unlocks extra newsletters, articles, discounted offers, and much more. Start advancing your knowledge today.
Unlock this book and the full library FREE for 7 days
Get unlimited access to 7000+ expert-authored eBooks and videos courses covering every tech area you can think of
Renews at $19.99/month. Cancel anytime
Banner background image