Monitoring the SOA platform—centralized management and monitoring
Monitoring in Oracle SOA Suite 11g enables closed loop governance by connecting design-time with runtime. Once services, their metadata, and associated policies are deployed, they begin to be automatically monitored and managed by the service infrastructure by regularly updating the console with a scorecard of runtime metrics collected.
Oracle SOA Suite 11g runs on top of numerous infrastructure components that include database management systems, J2EE compliant application servers and centralized identity management solutions. All Oracle SOA Suite 11g components have specific functions for administering and managing parts of an SOA infrastructure, each from a different perspective or for a different audience. In order to address the monitoring and management challenges described earlier, several areas need to be considered:
Monitoring solutions need to be provided at an enterprise level that encompass all related applications. This can begin with monitoring composite endpoints as well as the overall operational health of the infrastructure.
Real-time monitoring and proactive alerting based on runtime statistics of configured KPIs, availability, performance metrics, and service level agreements should be implemented.
Reporting of important information in the message (that is, payload), captured as a part of reporting functionality, can aid system administrators in better analysis and troubleshooting.
Oracle Enterprise Manager Fusion Middleware Control
Oracle Enterprise Manager Fusion Middleware Control, the web-based console into all Oracle SOA Suite 11g administrative functions, enables a bird's-eye view of your processes and their instances through a centralized management and monitoring console. It organizes a wide variety of performance data and administrative functions into distinct, web-based home pages. These home pages make it easy to locate the most important monitoring and performance data, and the most commonly used administrative functions for any Fusion Middleware component—all from your web browser!
Via Oracle Enterprise Manager Fusion Middleware Control, you can browse running servers, applications, and service engines to easily recognize and troubleshoot runtime problems in the SOA platform. As depicted in the following screenshot, the dashboard provides a comprehensive snapshot of the environment, including recent composite instances, state of currently deployed composites, and recently faulted transactions and their errors. From here, we typically drill down as necessary.

With out-of-the-box functionality provided by Oracle Enterprise Manager Fusion Middleware Control, you can obtain a real-time end-to-end view of the business transaction for SLA management, fault tracing, and problem determination, including the following:
Web services message processing totals and processing times
Transaction discovery/availability/state/status
Transaction performance
SOA registry and security
Service discovery and relationship/dependency mapping
Transaction audit trail and flow, faults, and rejected messages
JMX-based monitoring of all components of the SOA infrastructure
In addition, Oracle Enterprise Manager Fusion Middleware Control provides a comprehensive infrastructure management console that includes the following capabilities:
Code deployment and undeployment
Startup and shut down
Performance, metrics, and transaction monitoring
Security and policy management
Log management
Instance monitoring and management
Runtime exceptions and fault management
Diagnostics and tuning
Browsing, viewing, and modifying runtime MBeans
Web service testing
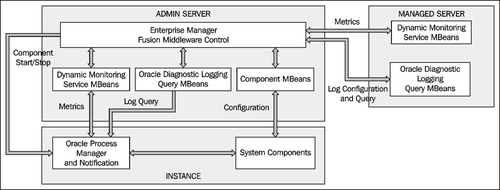
The following diagram shows the runtime architecture of Oracle Enterprise Manager Fusion Middleware Control. It describes how Oracle Enterprise Manager Fusion Middleware Control aggregates runtime metrics from different components.

Several internal services are leveraged to automatically collect these metrics behind the scenes:
Oracle Process Manager and Notification (OPMN): OPMN is responsible for aggregation of component status, runtime metrics, and component logs, and provides a central access point for this information. It can also act as an agent that can start/stop registered components.
Dynamic Monitoring Service (DMS): DMS hooks up with the runtime MBeans of all participating managed servers controlled by Oracle Enterprise Manager Fusion Middleware Control. This MBean periodically collects performance and monitoring statistics for all available components, and makes it available for the DMS collection MBeans on the Admin Server.
Oracle Diagnostics Logging (ODL): ODL is a standard Java API utility framework that is leveraged in Oracle Enterprise Manager Fusion Middleware Control to log diagnostic messages in a standard format across each domain.
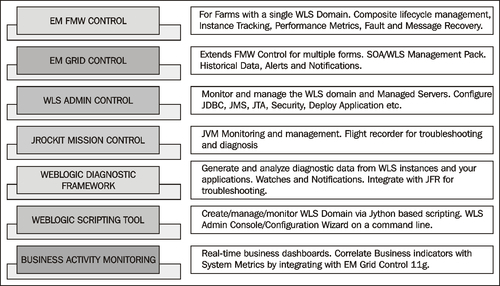
Apart from Oracle Enterprise Manager Fusion Middleware Control, there are a host of other management and monitoring frameworks available to administer various facets of your SOA infrastructure to help pinpoint issues. This includes JRockit Mission Control, WebLogic Diagnostics Framework (WLDF), Weblogic Scripting Tool (WLST), Oracle Enterprise Manager Grid Control, and more. Although these frameworks and tools are beyond the scope of this book, the following diagram provides a holistic view of each of these frameworks:


