Search icon CANCEL
Subscription
0
Cart icon
Cart
Close icon
You have no products in your basket yet
Save more on your purchases!
Savings automatically calculated. No voucher code required
Arrow left icon
All Products
Best Sellers
New Releases
Books
Videos
Audiobooks
Learning Hub
Newsletters
Free Learning
Arrow right icon
Arrow up icon
GO TO TOP
Microsoft PowerPoint Best Practices, Tips, and Techniques

You're reading from  Microsoft PowerPoint Best Practices, Tips, and Techniques

Product type Book
Published in Feb 2023
Publisher Packt
ISBN-13 9781839215339
Pages 338 pages
Edition 1st Edition
Languages
Author (1):
Chantal Bossé Chantal Bossé
Profile icon Chantal Bossé
Toc

Table of Contents (16) Chapters close

Preface 1. Chapter 1: Analyzing Your Audience and Presentation Delivery Needs 2. Chapter 2: Using Industry Best Practices to Design Better Visuals 3. Chapter 3: Leveraging PowerPoint’s Slide Master for Design 4. Chapter 4: Using PowerPoint’s Document Masters for Accessible Handouts and Notes 5. Chapter 5: Using Artificial Intelligence to Improve Your Visuals 6. Chapter 6: Adding and Modifying Visual Elements 7. Chapter 7: Adding and Modifying Multimedia Elements 8. Chapter 8: Working with Transitions and Animations 9. Chapter 9: Building Flexibility and Interactivity into Your Presentations 10. Chapter 10: Using PowerPoint Third-Party Add-Ins 11. Chapter 11: Practicing Your Presentation Delivery 12. Chapter 12: Using Presenter View 13. Chapter 13: PowerPoint Live and Interactive Features in Microsoft Teams 14. Index 15. Other Books You May Enjoy

Inserting and modifying a map

When I say you need to start thinking visually when creating presentations, it means to stop being on autopilot when creating your content. Any content you need to deliver needs to be examined to seek visual ways to create it. Let’s look at an example of content that can be greatly improved with one of PowerPoint’s features (Office 365 (O365) only): inserting a map. For the slide example in Figure 6.1, I created a table with data showing four Canadian provinces that should have more than 6 million people by 2043:
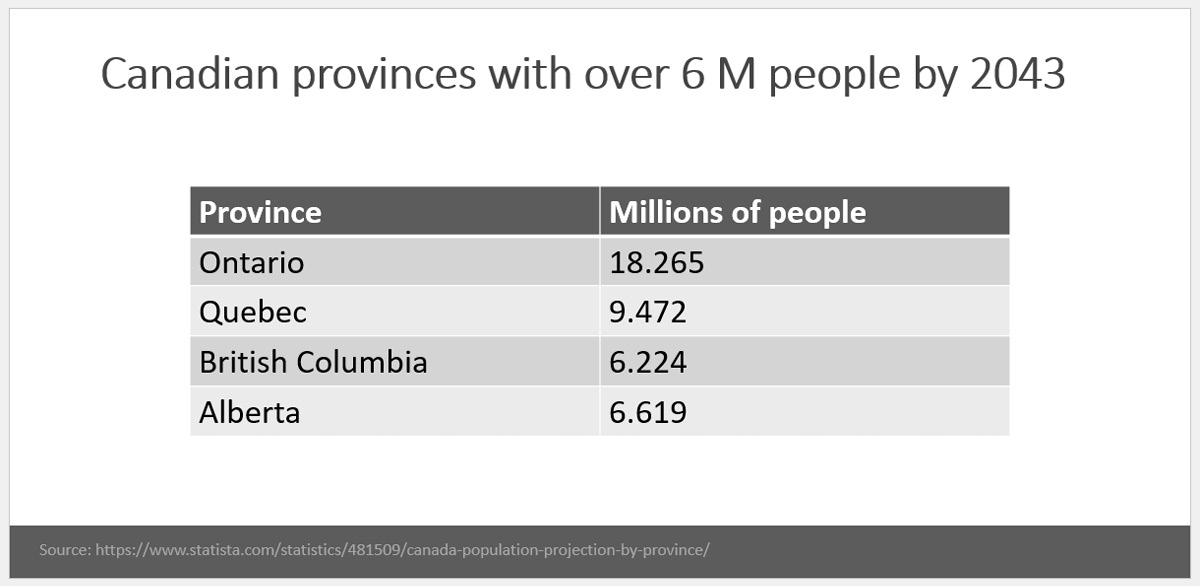
Figure 6.1 – Table listing four Canadian provinces with their population by 2043

Figure 6.1 – Table listing four Canadian provinces with their population by 2043

It is not a bad slide per se, but it does lack visual appeal. Instead, we can leverage PowerPoint’s map feature so that we can make each province visible within Canada, as in Figure 6.2:
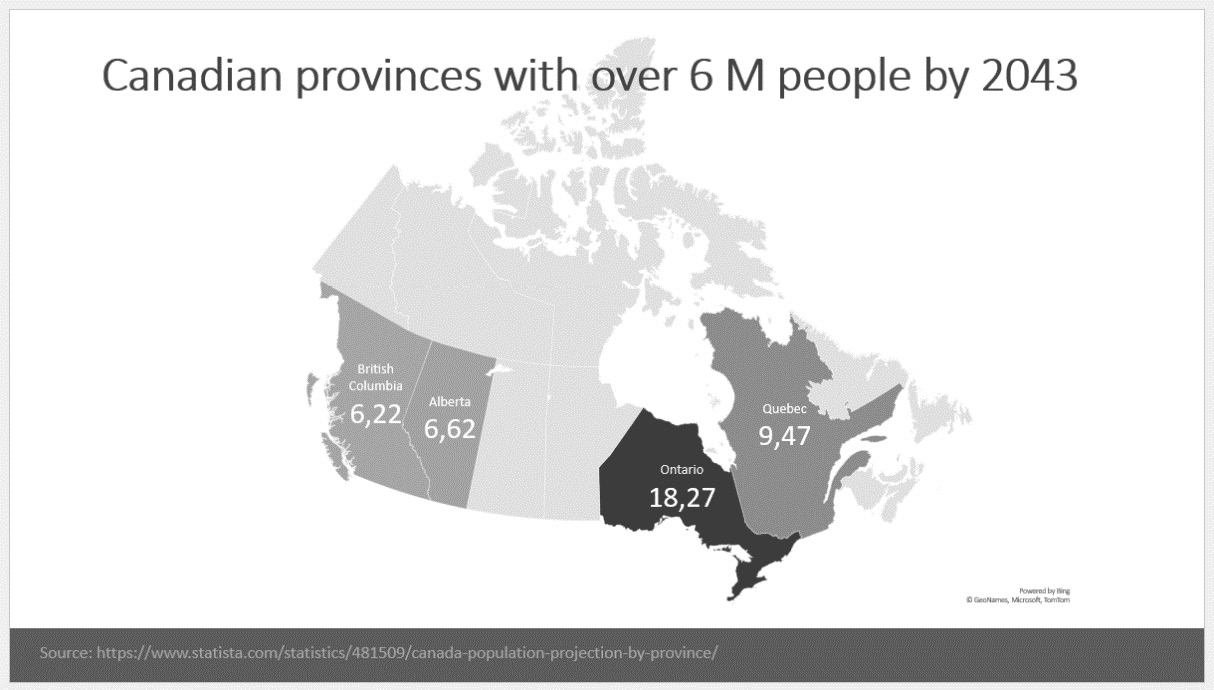
Figure 6.2 – Population information shown in a map of Canada

Figure 6.2 – Population information shown in a map of Canada

As you can see, it adds...

lock icon The rest of the chapter is locked
Register for a free Packt account to unlock a world of extra content!
A free Packt account unlocks extra newsletters, articles, discounted offers, and much more. Start advancing your knowledge today.
Unlock this book and the full library FREE for 7 days
Get unlimited access to 7000+ expert-authored eBooks and videos courses covering every tech area you can think of
Renews at ₹800/month. Cancel anytime