Search icon CANCEL
Subscription
0
Cart icon
Cart
Close icon
You have no products in your basket yet
Save more on your purchases!
Savings automatically calculated. No voucher code required
Arrow left icon
All Products
Best Sellers
New Releases
Books
Videos
Audiobooks
Learning Hub
Newsletters
Free Learning
Arrow right icon
Arrow up icon
GO TO TOP
MATLAB for Machine Learning

You're reading from  MATLAB for Machine Learning

Product type Book
Published in Aug 2017
Publisher Packt
ISBN-13 9781788398435
Pages 382 pages
Edition 1st Edition
Languages
Authors (2):
Giuseppe Ciaburro Giuseppe Ciaburro
Profile icon Giuseppe Ciaburro
Pavan Kumar Kolluru Pavan Kumar Kolluru
Profile icon Pavan Kumar Kolluru
View More author details
Toc

Table of Contents (17) Chapters close

Title Page
Credits
Foreword
About the Author
About the Reviewers
www.PacktPub.com
Customer Feedback
Preface
1. Getting Started with MATLAB Machine Learning 2. Importing and Organizing Data in MATLAB 3. From Data to Knowledge Discovery 4. Finding Relationships between Variables - Regression Techniques 5. Pattern Recognition through Classification Algorithms 6. Identifying Groups of Data Using Clustering Methods 7. Simulation of Human Thinking - Artificial Neural Networks 8. Improving the Performance of the Machine Learning Model - Dimensionality Reduction 9. Machine Learning in Practice

Data fitting with neural networks


Data fitting is the process of building a curve or a mathematical function that has the best match with a set of previously collected points. Curve fitting can relate to both interpolations, where exact data points are required, or smoothing, where a flat function that approximates the data is built. We are talking about curves fitting in a regression analysis, which is most concerned with statistical inference problems, as well as the uncertainty that a curve coincides with observed data that has random errors. The approximate curves obtained from the data fitting can be used to help display data, to predict the values of a function where no data is available, and to summarize the relationship between two or more variables.

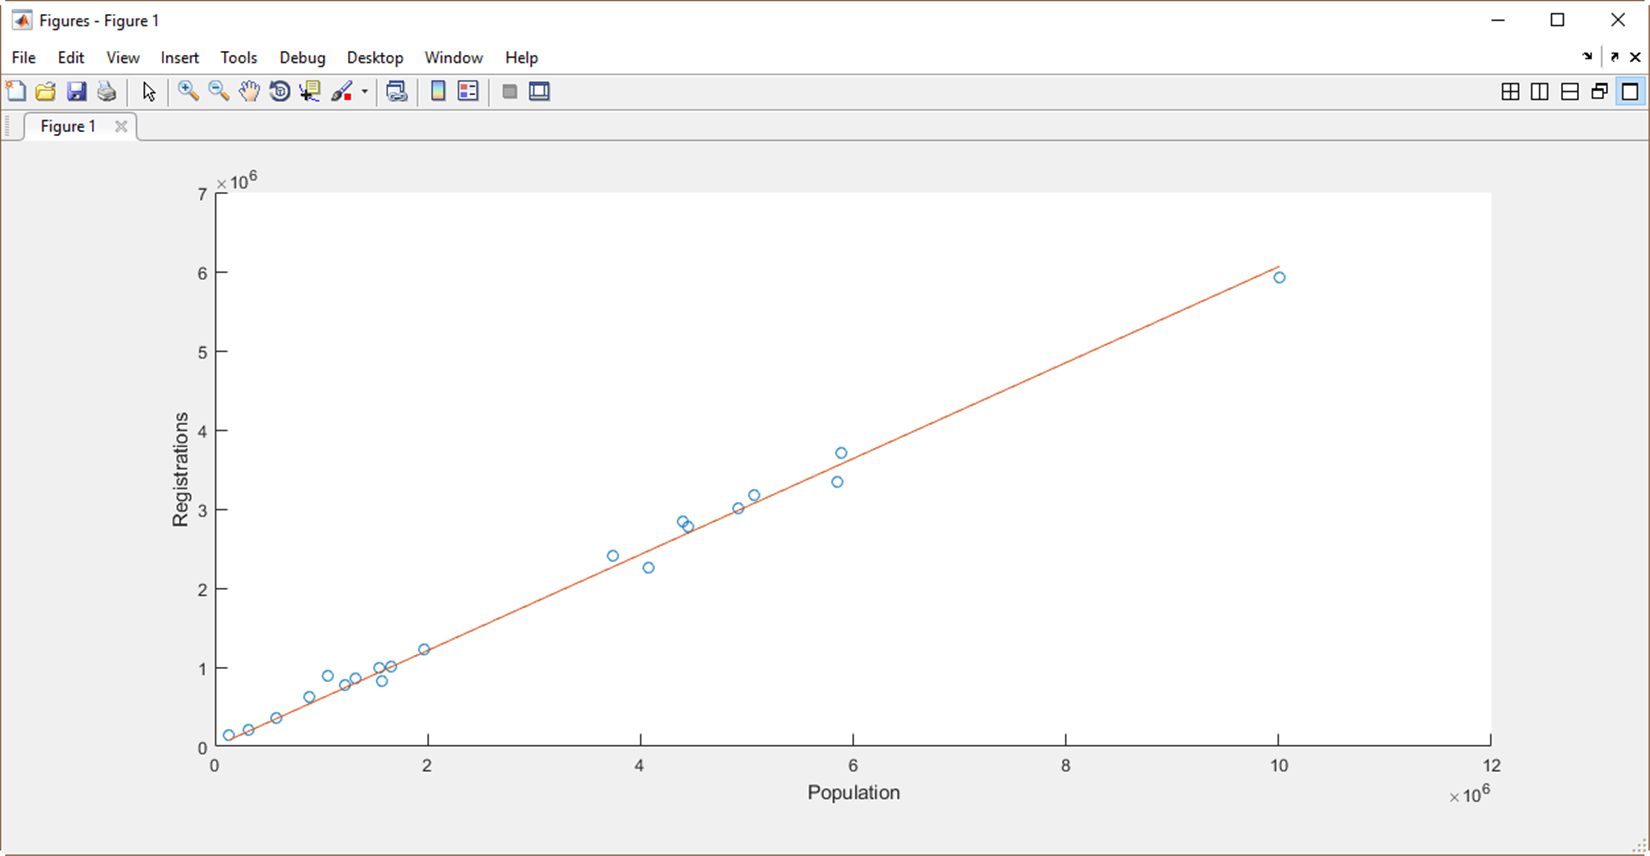
Figure 7.18: Linear interpolation of collected data

We have seen some examples of curve fitting in the regression chapter. On that occasion, we could see that the mathematical formulas that allow us to predict the trend of a particular...

lock icon The rest of the chapter is locked
Register for a free Packt account to unlock a world of extra content!
A free Packt account unlocks extra newsletters, articles, discounted offers, and much more. Start advancing your knowledge today.
Unlock this book and the full library FREE for 7 days
Get unlimited access to 7000+ expert-authored eBooks and videos courses covering every tech area you can think of
Renews at ₹800/month. Cancel anytime