Statistics and Machine Learning Toolbox
The Statistics and Machine Learning Toolbox contains all the tools necessary to extract knowledge from large datasets. It provides functions and apps to analyze, describe, and model data. Starting exploratory data analysis becomes a breeze with the descriptive statistics and graphs contained in the toolbox. Furthermore, fitting probability distributions to data, generating random numbers, and performing hypothesis tests will be extremely easy. Finally through the regression and classification algorithms, we can draw inferences from data and build predictive models.
For data mining, the Statistics and Machine Learning Toolbox offers feature selection, stepwise regression, Principal Component Analysis (PCA), regularization, and other dimensionality reduction methods that allow the identification of variables or functions that impact your model.
In this toolbox are developed supervised and unsupervised machine learning algorithms, including Support Vector Machines (SVMs), decision trees, k-Nearest Neighbor (KNN), k-means, k-medoids, hierarchical clustering, Gaussian Mixture Models (GMM), and hidden Markov models (HMM). Through the use of such algorithms, calculations on datasets that are too large to be stored in memory can be correctly executed. In the following screenshot, product capabilities of the Statistics and Machine Learning Toolbox are shown, extracted from the MathWorks site:
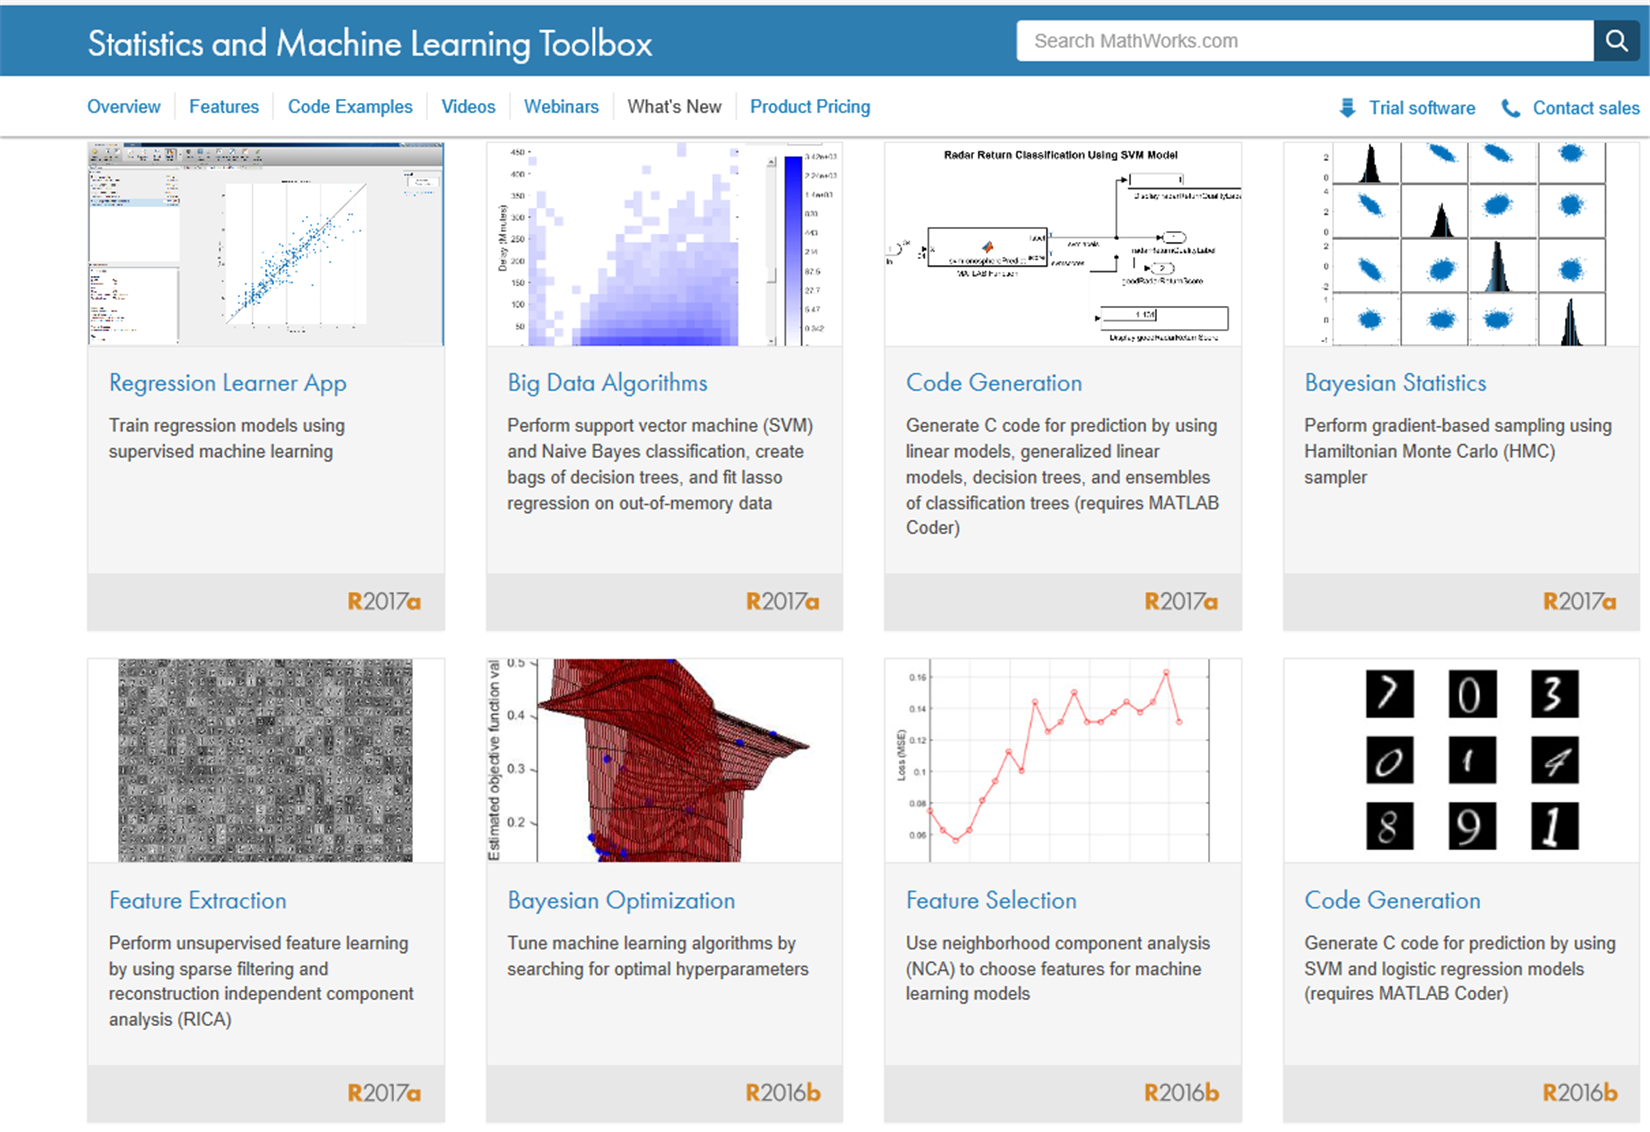
Figure 1.14: Product capabilities of the Statistics and Machine Learning Toolbox
Here is a descriptive list of the key features of this tool; you will find the main topics of the machine learning field:
- Regression techniques, including linear, generalized linear, nonlinear, robust, regularized, ANOVA, repeated measures, and mixed-effects models
- Big data algorithms for dimension reduction, descriptive statistics, k-means clustering, linear regression, logistic regression, and discriminant analysis
- Univariate and multivariate probability distributions, random and quasi-random number generators, and Markov chain samplers
- Hypothesis tests for distributions, dispersion, and location; Design of Experiments (DOE) techniques for optimal, factorial, and response surface designs
- Classification Learner app and algorithms for supervised machine learning, including SVMs, boosted and bagged decision trees, KNN, Naive Bayes, discriminant analysis, and Gaussian process regression
- Unsupervised machine learning algorithms, including k-means, k-medoids, hierarchical clustering, Gaussian mixtures, and HMMs
- Bayesian optimization for tuning machine learning algorithms by searching for optimal hyperparameters
The following are the product resources of the Statistics and Machine Learning Toolbox:
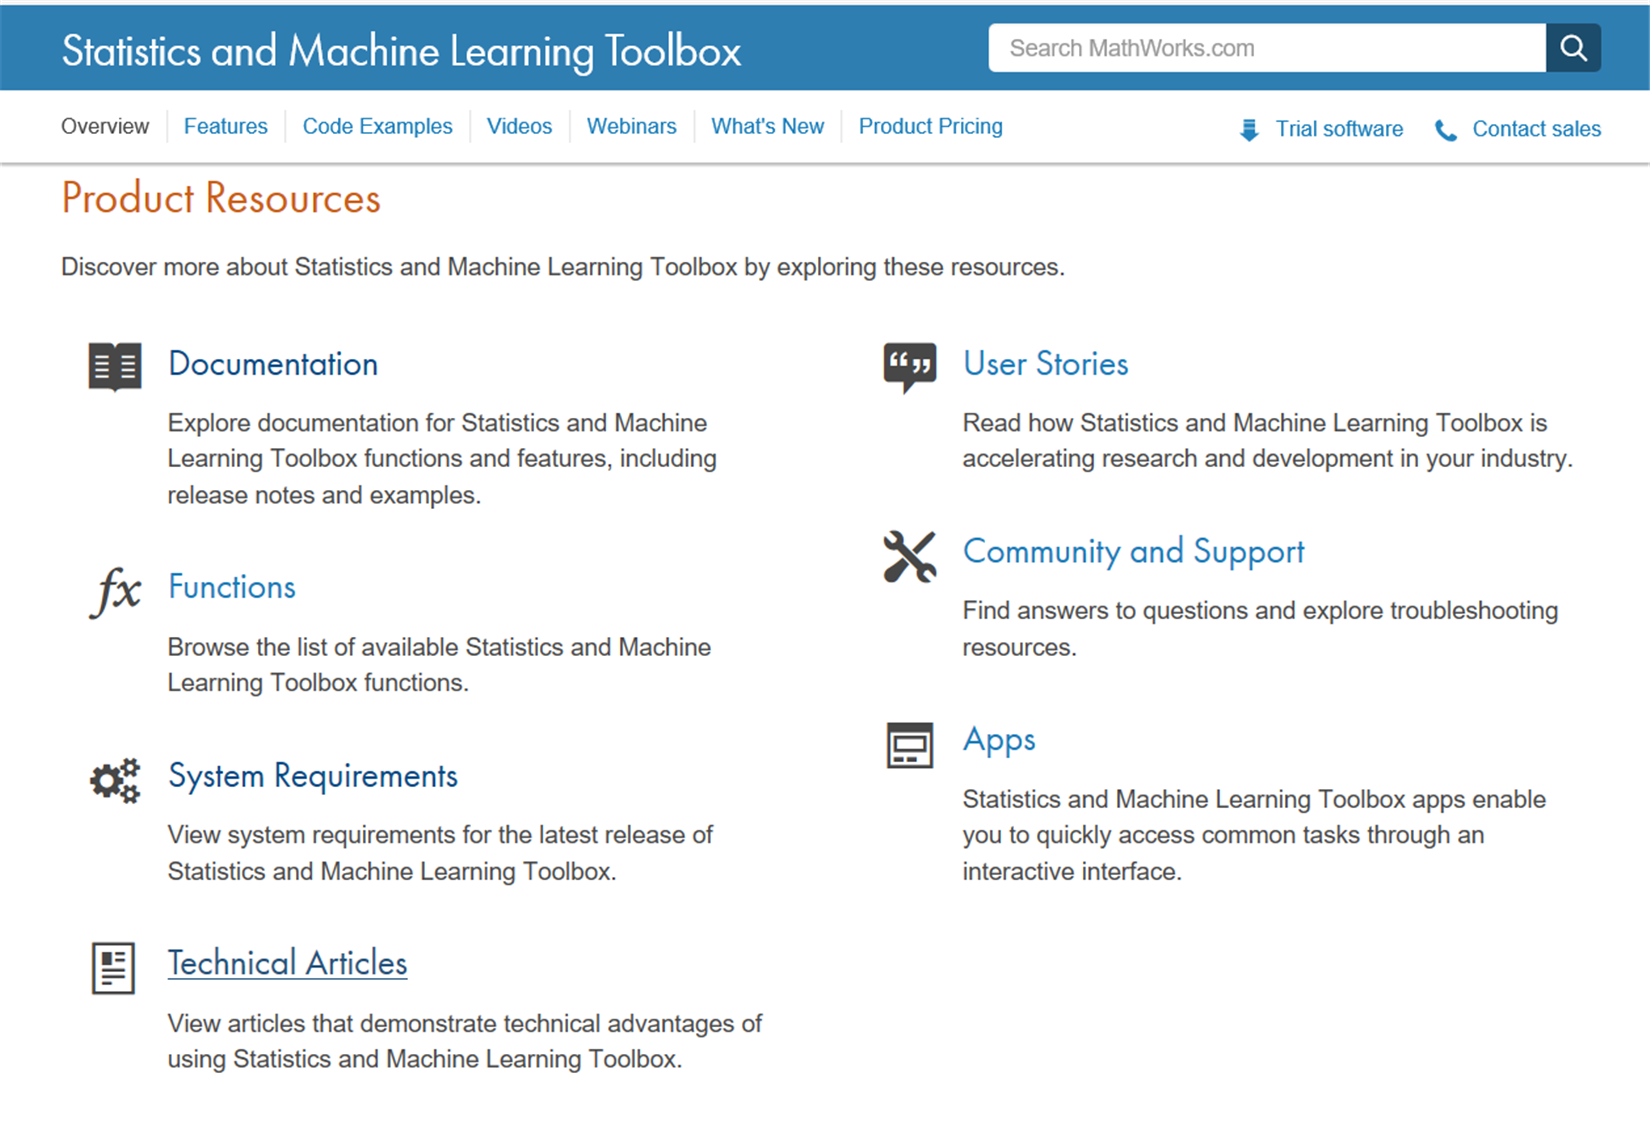
Figure 1.15: Product resources of the Statistics and Machine Learning Toolbox
Note
For a more comprehensive overview of the Statistics and Machine Learning Toolbox's capabilities, you can connect to the manufacturer's website at the following link: https://www.mathworks.com/products/statistics.html.
Datatypes
Before we start working with the Statistics and Machine Learning Toolbox, we should learn how to format the data to be processed by MATLAB. The Statistics and Machine Learning Toolbox supports only some specific datatypes for input arguments. MATLAB might return an error or unexpected results if we specify data in an unsupported type.
Supported datatypes
The datatypes supported are as follow:
- Numeric scalars, vectors, matrices, or arrays having single or double precision entries. These data forms have the single or double datatype.
- Cell arrays of character vectors; character, logical, or categorical arrays; or numeric vectors for categorical variables representing grouping data. These data forms have the cellstr, char, logical, categorical, and single or double datatype, respectively.
- Some functions support tabular arrays for heterogeneous. The table datatype contains variables of any of the datatypes previously listed.
- Some functions accept
gpuArrayinput arguments so that they execute on the GPU.
Unsupported datatypes
These are as follows:
- Complex numbers.
- Custom numeric datatypes, for example, a variable that is double precision and an object.
- Signed or unsigned numeric integers for non-grouping data, for example,
unint8andint16. - Sparse matrices, for example, matrix
ONEsuch thatissparse(ONE)returns1. To use data that is of datatype sparse, recast the data to a matrix using full.
What can you do with the Statistics and Machine Learning Toolbox?
In the previous section, we analyzed the main features of the Statistics and Machine Learning Toolbox and how to format the data for following processes. It is now legitimate to ask: What can we really do with all the functions that MATLAB makes available to us? In this section, we will see a series of real case solutions through the use of such tools. Let us see some applications.
Data mining and data visualization
Data mining is the process of finding correlations among several fields of large relational databases. Through this process, data is analyzed from different perspectives and summarized into useful information. This information will then be used to adopt the necessary strategies to solve a problem.
MATLAB has several tools that allow us to perform a data mining analysis. In particular, the Statistics and Machine Learning Toolbox presents many techniques that give us the opportunity to obtain useful information from data. Good examples of these tools are:
- Statistical plotting with interactive graphics
- Descriptive statistics for large datasets
An example of visualizing multivariate data is shown in the following figure:
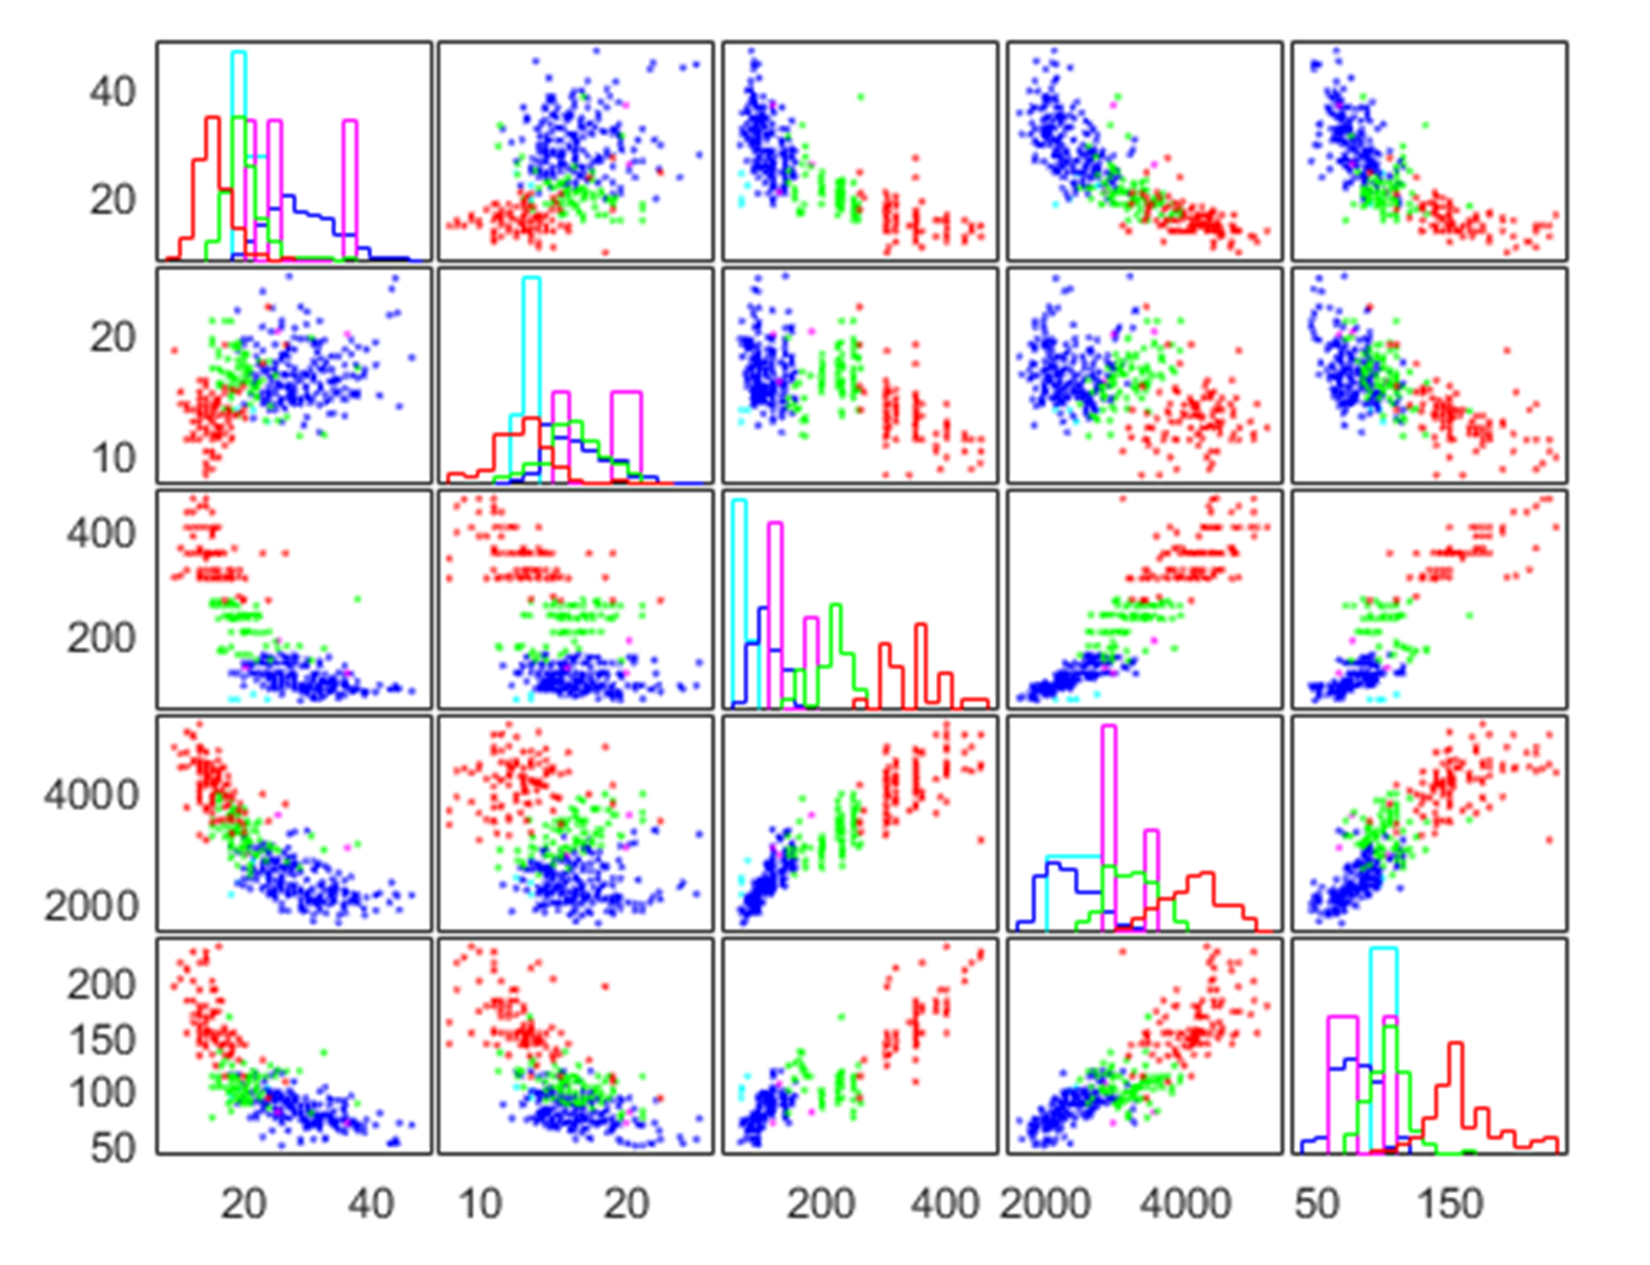
Figure 1.16: Visualizing multivariate data
For example, we can start our analysis from visual exploration of data through a statistical plotting with interactive graphics. In this regard, MATLAB has many graphs and charts ready for use. In addition, the Statistics and Machine Learning Toolbox augments MATLAB plot types with probability plots, box plots, histograms, scatter histograms, 3D histograms, control charts, and quantile-quantile plots. For multivariate analysis, dendrograms, biplots, parallel coordinate charts, and Andrews plots are included in the toolbox.
In some cases, we must visualize multivariate data. Many statistical analyses require only two variables: A predictor variable (independent variable) and a response variable (dependent variable). The relationships between the two types of variables is easy to visualize using 2D scatter plots, bivariate histograms, boxplots, and so on. Similarly it is possible to extend the analysis to trivariate data and display it with 3D scatter plots, or 2D scatter plots with a third variable encoded. However, many datasets involve a larger number of variables, making direct visualization more difficult. In MATLAB, it's possible to visualize multivariate data using various statistical plots, through the Statistics and Machine Learning Toolbox (Figure 1.16).
Finally we can extract useful information using a descriptive statistic. A descriptive statistic identifies a set of techniques and tools aimed at fulfilling one of the top priorities of the statistic: describe, represent, and summarize the observed data to analyze a certain phenomenon. The Statistics and Machine Learning Toolbox includes functions for calculating:
- Measures of central tendency, including average, median, and various means
- Measures of dispersion, including range, variance, standard deviation, and mean or median absolute deviation
- Linear and rank correlation
- Results based on data with missing values
- Percentile and quartile estimates
- Density estimates using a kernel-smoothing function
Regression analysis
Regression analysis is a technique used to analyze a series of data that consists of a dependent variable and one or more independent variables. The purpose is to estimate a possible functional relationship between the dependent variable and the independent variables. Using this technique, we can build a model in which a continuous response variable is a function of one or more predictors.
In the Statistics and Machine Learning Toolbox, there are a variety of regression algorithms, including:
- Linear regression
- Nonlinear regression
- Generalized linear models
- Mixed-effects models
A scatter plot of the linear regression model is shown in the following figure.
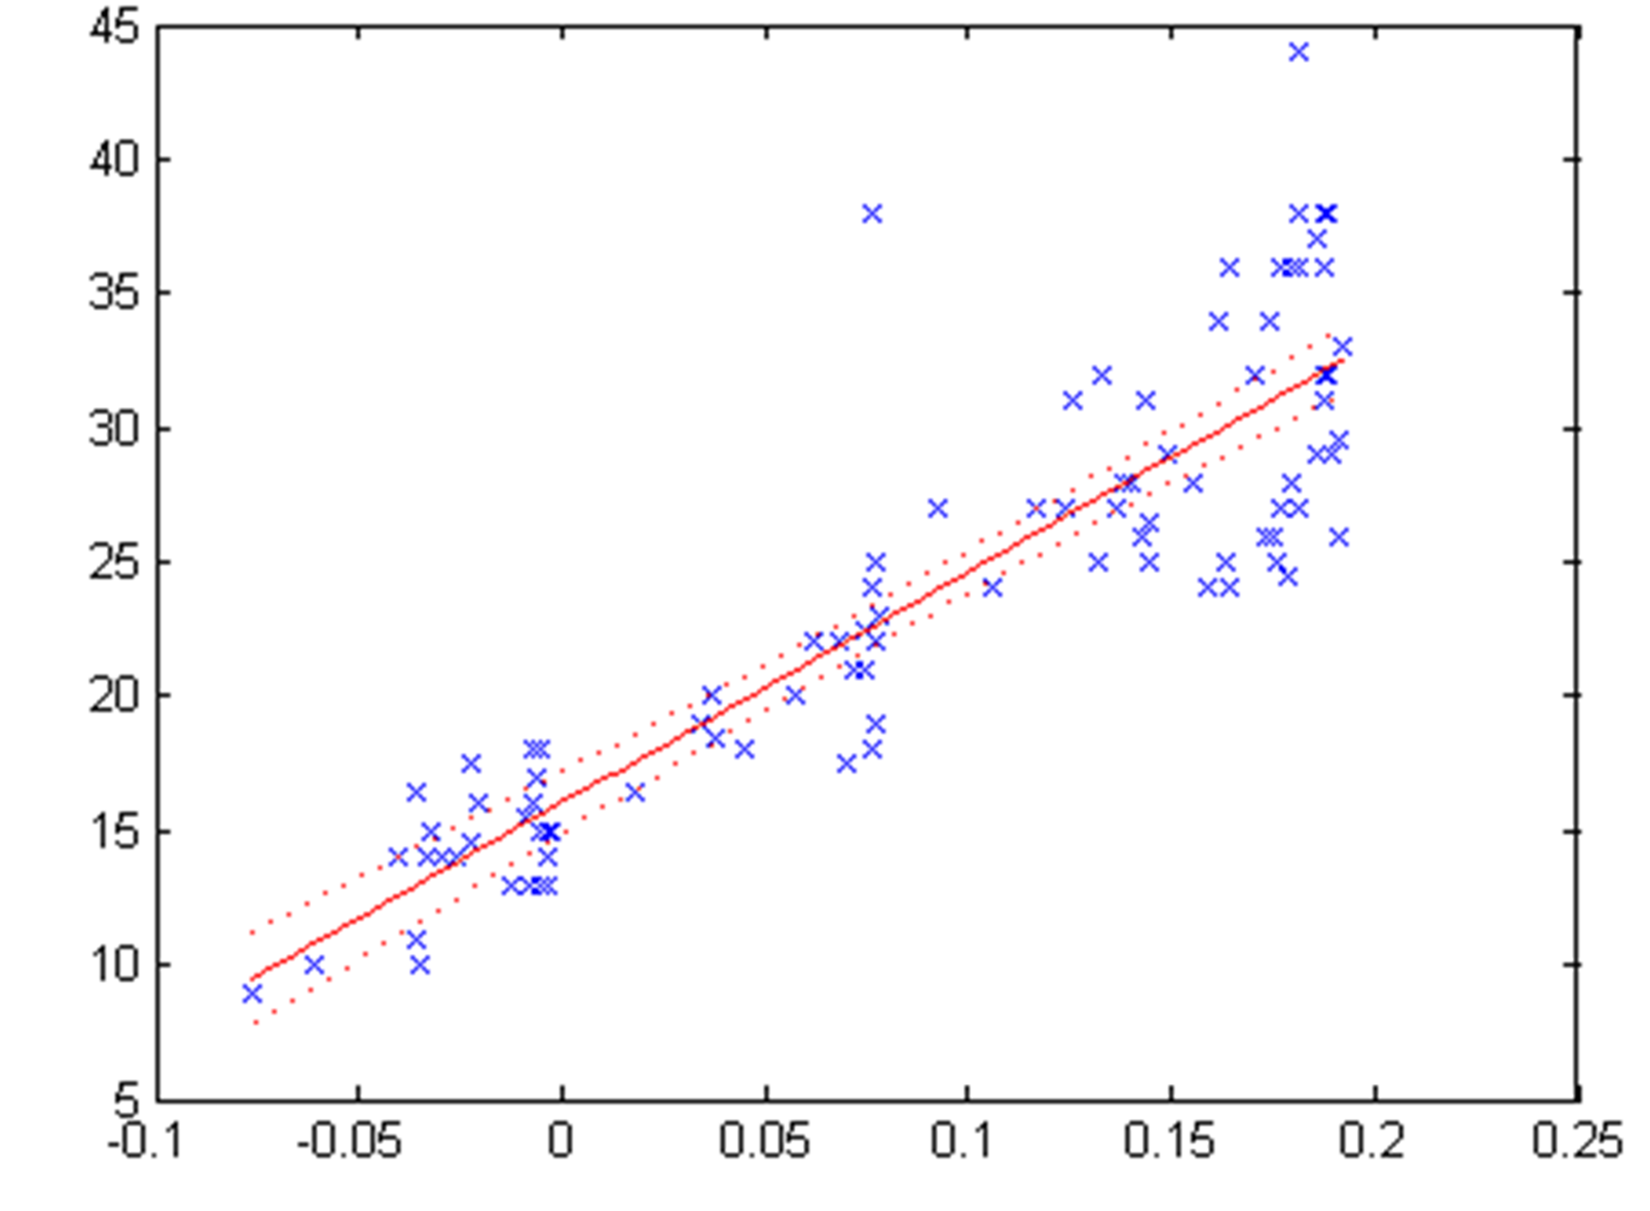
Figure 1.17: Scatter plot of linear regression model
To study the relationship between two variables, a scatter plot is useful, in which we show the values of the independent variable X on the horizontal axis and the values of the dependent variable Y on the vertical axis. Using a regression model, we can express the relationship between two variables with functions that are more or less complex. Simple linear regression is suitable when the values of X and Y are distributed along a straight line in the scatter plot (Figure 1.17).
Classification
Classification models are supervised learning methods and are aimed at predicting a categorical target. From a set of observations for which the class is known, a model that allows us to make predictions is generated.
The Statistics and Machine Learning Toolbox offers apps and functions that cover a variety of parametric and non-parametric classification algorithms, such as:
- Logistic regression
- Boosted and bagged decision trees, including AdaBoost, LogitBoost, GentleBoost, and RobustBoost
- Naive Bayes classification
- KNN classification
- Discriminant analysis (linear and quadratic)
- SVM (binary and multiclass classification)
The Classification Learner app is a very useful tool that executes more request activities such as interactively explore data, select features, specify cross-validation schemes, train models, and assess results. We can use it to perform common tasks such as:
- Importing data and specifying cross-validation schemes
- Exploring data and selecting features
- Training models using several classification algorithms
- Comparing and assessing models
- Sharing trained models for use in applications such as computer vision and signal processing
Using the Classification Learner app, we can choose between various algorithms to train and validate classification models. After the training, compare the models' validation errors and choose the best one on the basis of results.
The following figure shows the Classification Learner app:
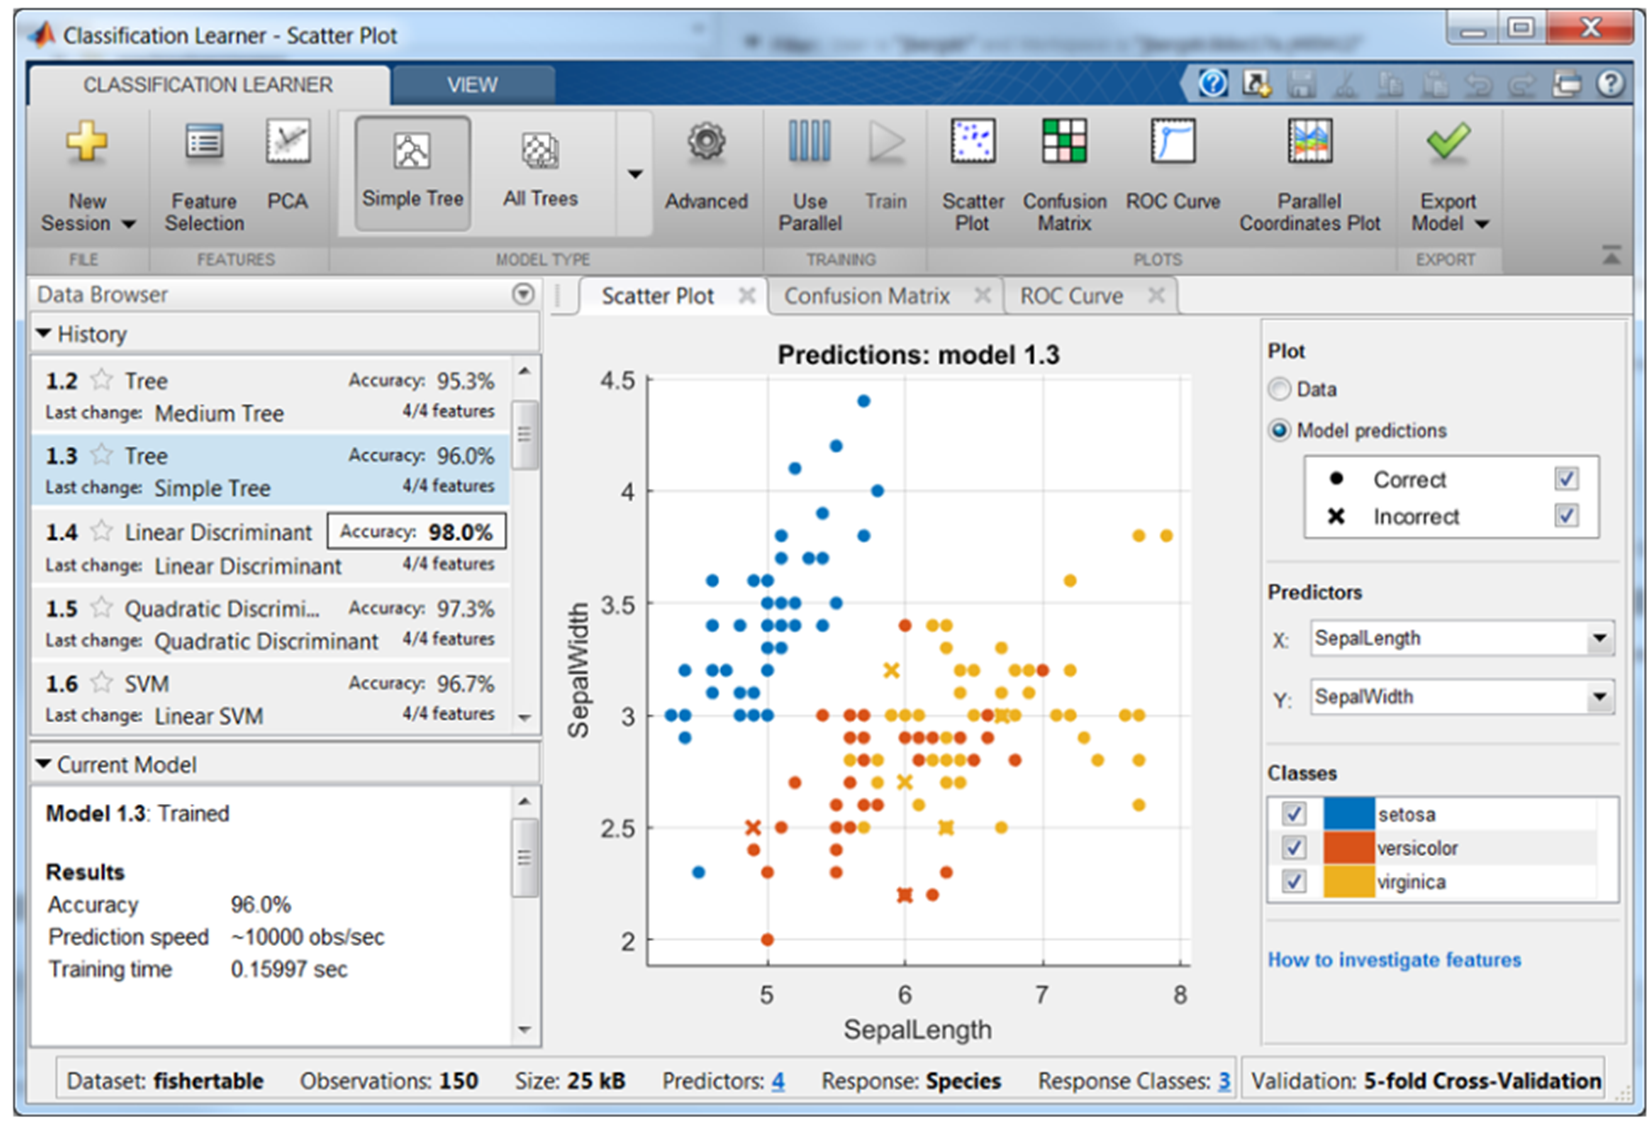
Figure 1.18: The Classification Learner with a history list containing various classifier types
Cluster analysis
Cluster analysis is a multivariate analysis technique through which it is possible to group the statistical units so as to minimize the logic distance of each group and the logic distance between the groups. The logic distance is quantified by means of measures of similarity/dissimilarity between the defined statistical units.
The Statistics and Machine Learning Toolbox provides several algorithms to carry out cluster analysis. Available algorithms include:
- k-means
- k-medoids
- Hierarchical clustering
- GMM
- HMM
When the number of clusters is unknown, we can use cluster evaluation techniques to determine the number of clusters present in the data based on a specified metric.
A typical cluster analysis result is shown in the following figure:
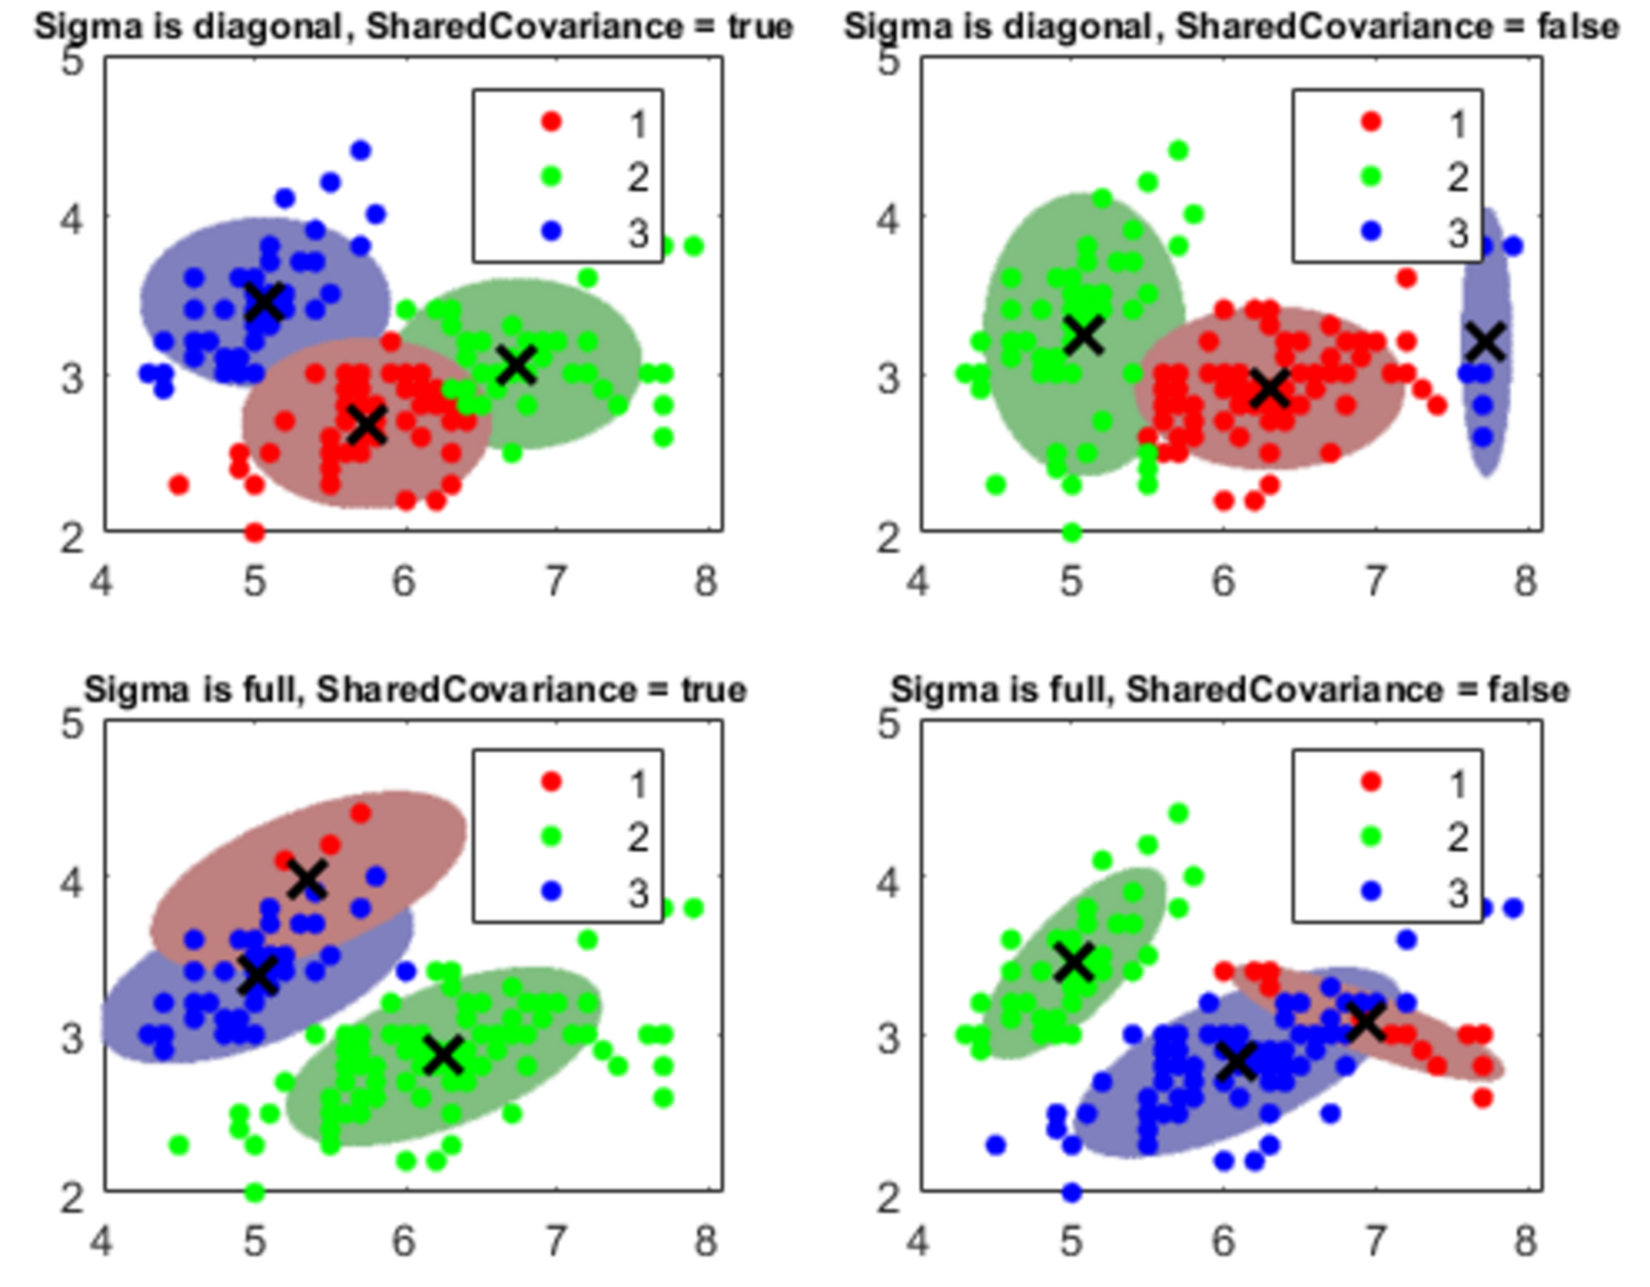
Figure 1.19: A cluster analysis example
In addition, the Statistics and Machine Learning Toolbox allows viewing clusters by creating a dendrogram plot to display a hierarchical binary cluster tree. Then, we optimize the leaf order to maximize the sum of the similarities between adjacent leaves. Finally, for grouped data with multiple measurements for each group, we create a dendrogram plot based on the group means computed using a multivariate analysis of variance.
Dimensionality reduction
Dimensionality reduction is the process of converting a set of data with many variables into data with lesser dimensions but ensuring similar information. It can help improve model accuracy and performance, improve interpretability, and prevent overfitting. The Statistics and Machine Learning Toolbox includes many algorithms and functions for reducing the dimensionality of our datasets. It can be divided into feature selection and feature extraction. Feature selection approaches try to find a subset of the original variables. Feature extraction reduces the dimensionality in the data by transforming data into new features.
As already mentioned, feature selection finds only the subset of measured features (predictor variables) that give the best predictive performance in modeling the data. The Statistics and Machine Learning Toolbox includes many feature selection methods, as follows:
- Stepwise regression: Adds or removes features until there is no improvement in prediction accuracy. Especially suited for linear regression or generalized linear regression algorithms.
- Sequential feature selection: Equivalent to stepwise regression, this can be applied with any supervised learning algorithm.
- Selecting features for classifying high-dimensional data.
- Boosted and bagged decision trees: Calculate the variable's importance from out-of-bag errors.
- Regularization: Remove redundant features by reducing their weights to zero.
Otherwise, feature extraction transforms existing features into new features (predictor variables) where less-descriptive features can be ignored.
The Statistics and Machine Learning Toolbox includes many feature extraction methods, as follows:
- PCA: This can be applied to summarize data in fewer dimensions by projection onto a unique orthogonal basis
- Non-negative matrix factorization: This can be applied when model terms must represent non-negative quantities
- Factor analysis: This can be applied to build explanatory models of data correlations
The following are step-wise regression example charts:
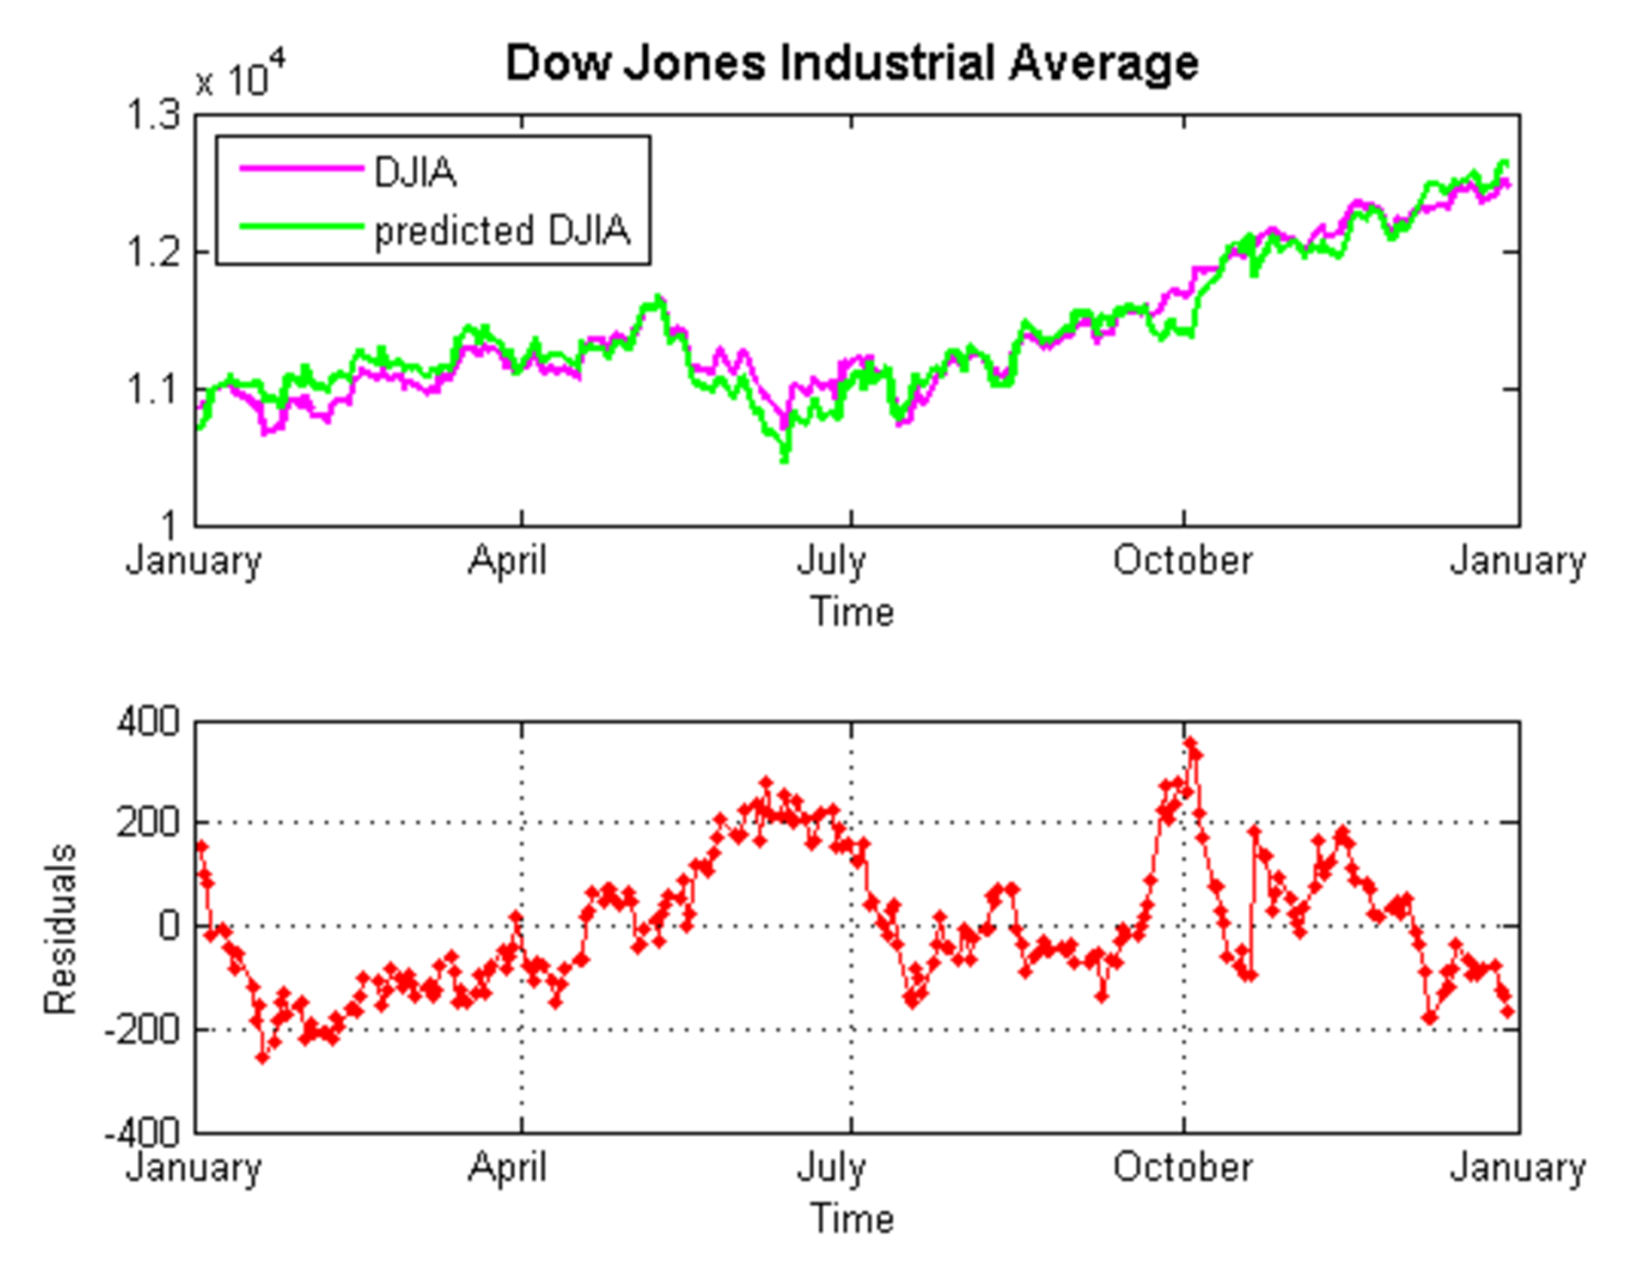
Figure 1.20: Step-wise regression example