Search icon CANCEL
Subscription
0
Cart icon
Your Cart (0 item)
Close icon
You have no products in your basket yet
Save more on your purchases! discount-offer-chevron-icon
Savings automatically calculated. No voucher code required.
Arrow left icon
Explore Products
Best Sellers
New Releases
Books
Videos
Audiobooks
Learning Hub
Newsletter Hub
Free Learning
Arrow right icon
timer SALE ENDS IN
0 Days
:
00 Hours
:
00 Minutes
:
00 Seconds
Arrow up icon
GO TO TOP
Intel Galileo Networking Cookbook

You're reading from   Intel Galileo Networking Cookbook Over 50 recipes that will help you use the Intel Galileo board to build exciting network-connected projects

Arrow left icon
Product type Paperback
Published in Aug 2015
Publisher
ISBN-13 9781785281198
Length 174 pages
Edition 1st Edition
Languages
Tools
Concepts
Arrow right icon
Author (1):
Arrow left icon
Marco Schwartz Marco Schwartz
Author Profile Icon Marco Schwartz
Marco Schwartz
Arrow right icon
View More author details
Toc

Table of Contents (10) Chapters Close

Preface 1. Installing and Configuring Linux FREE CHAPTER 2. Connecting External Sensors 3. Controlling Hardware Devices 4. Creating a Web Server 5. Hosting Applications on the Galileo Board 6. Local Network Monitoring 7. Cloud Data Monitoring 8. Building a Home Automation System Index

Monitoring data remotely from a dashboard


In this recipe, we are going to build a project on top of what we just created. We are going to use the data that was logged on dweet.io, and display this data in an online dashboard.

Getting ready

We are going to use a free online dashboard to display the data graphically; Freeboard.io. You can find this at the Freeboard website:

https://www.freeboard.io/

You can now create a new account, and, once this is done, you can create a new dashboard:
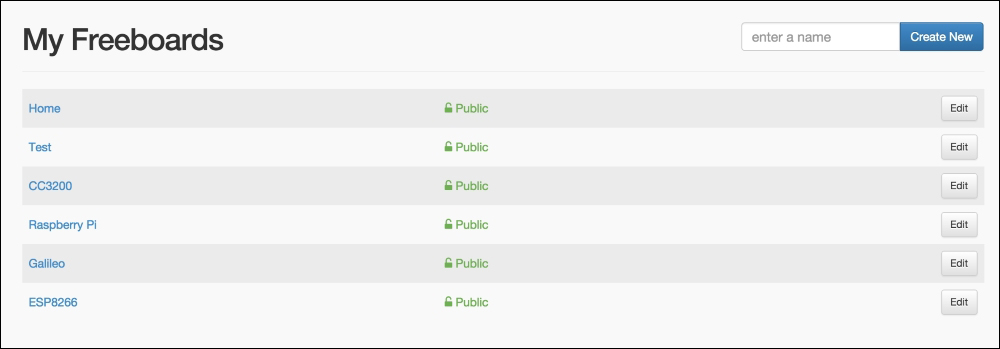
Make sure that the previous recipe, which sends data to dweet.io continuously, is still running.

How to do it...

We are now going to configure our newly created dashboard so that it can display the measurements from the Galileo board.

The first step is to create a data source that will stream the data into our dashboard. You can do this by clicking on the ADD button:

This will take you to a panel where you can fill in the details about your datasource. Basically, you just need to select dweet.io and then enter the...

lock icon The rest of the chapter is locked
Register for a free Packt account to unlock a world of extra content!
A free Packt account unlocks extra newsletters, articles, discounted offers, and much more. Start advancing your knowledge today.
Unlock this book and the full library FREE for 7 days
Get unlimited access to 7000+ expert-authored eBooks and videos courses covering every tech area you can think of
Renews at $19.99/month. Cancel anytime
Banner background image