


What happens when you connect to data in Tableau Desktop?
When you connect to data in Tableau Desktop, Tableau will begin to interpret your data. First, it will create a field for each column of your data. Second, it will assign a data type to each of the fields. Tableau does this because it is powered by a proprietary query technology, called VizQL. VizQL is the technology that underpins Tableau, enabling a visual analytics experience by automatically creating visualizations for a user. This is very different than most business intelligence tools that rely on the user to tell the tool how they would like the data visualized through the picking of a chart type.
For VizQL to work, Tableau needs to know the type of each field. The two main field types in Tableau are discrete and continuous:
- Discrete fields: Colored blue in Tableau. By the Oxford Dictionary’s definition, discrete means independent of other things of the same type. When placed on a Tableau visualization, discrete fields usually create a header – similar to a column header in a spreadsheet.
- Continuous fields: Colored green in Tableau. Again, using the Oxford Dictionary, continuous is defined as happening or existing for a period of time without being interrupted. When placed on a Tableau visualization, continuous fields create an axis – that is, they create a visual display of data.
One way to think about the relationship between discrete and continuous fields is that continuous fields are recording measurements and discrete fields are describing those measurements. In a statement, this can usually be phrased as continuous by discrete – for example, sales (continuous) by region (discrete), as shown in Figure 1.1.

Figure 1.1 – Demonstrating discrete and continuous fields
Within these two main field types, there are additional field types that inform VizQL how to create a visual display when they are brought onto the Tableau canvas. These can be seen in Figure 1.2 and are as follows:
- Number (decimal): A number that allows fractions. Represented by a # symbol in the Tableau UI.
- Number (whole): An integer or a number with no decimals. Also represented by a # symbol.
- String: A field that contains alphanumeric characters. Represented by abc.
- Date: Tableau accepts several date formatting options. Represented by a calendar icon.
- Date & Time: A date field with granularity down to the second of a day. Represented by a calendar icon plus an analog clock.
- Geographical/Spatial: A field that can be plotted on a map. There are many subtypes of geographical fields, including country, state/province, city, postal/zip code, airport, congressional district, NUTS (Europe), and a latitude or longitude value. Represented by a globe icon.
- Binary/Boolean: A field that takes a true/false or yes/no condition. Represented by a T/F icon.
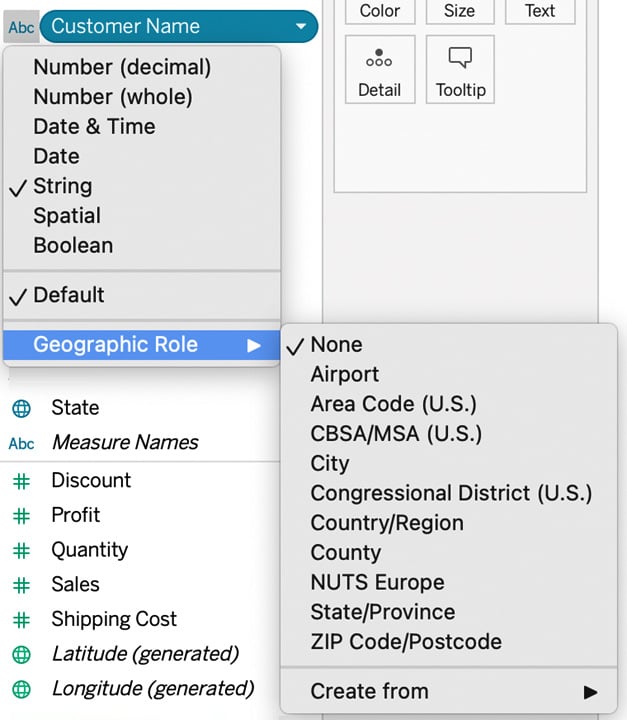
Figure 1.2 – Additional field types
Let’s open Tableau Desktop and connect to the Superstore sales 2022.csv file. This file contains the sample data that comes along with the Tableau installation. It is a sample (and fictional) retail dataset that is useful for demonstration and learning purposes. We will use this data throughout the book when we can. This will help you as you increase your Tableau learning journey, as most of Tableau’s training videos use the same data:
- Open Tableau Desktop.
- Click on the Connect to Data blue hyperlink near the top-left-hand side of the Tableau Desktop UI:
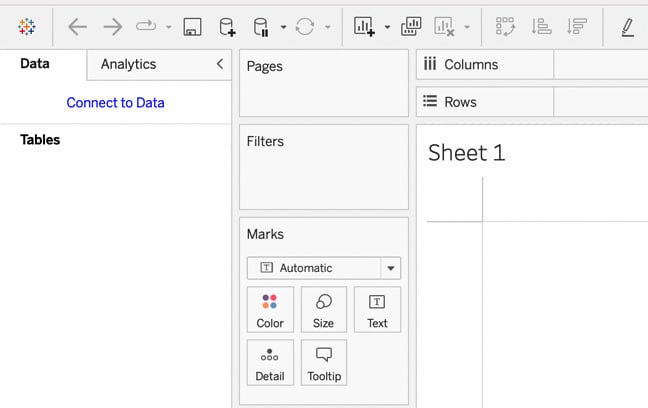
Figure 1.3 – Connect to Data in Tableau Desktop
- You are now presented with many different options for data sources. We will discuss some of these in upcoming chapters. For now, find the To a file section and click on the Text file option. Navigate to the
Superstore sales 2022.csvfile in the location you saved it on your computer. Click Open. - Tableau will bring the data in and bring focus to the Data Source tab, as follows:
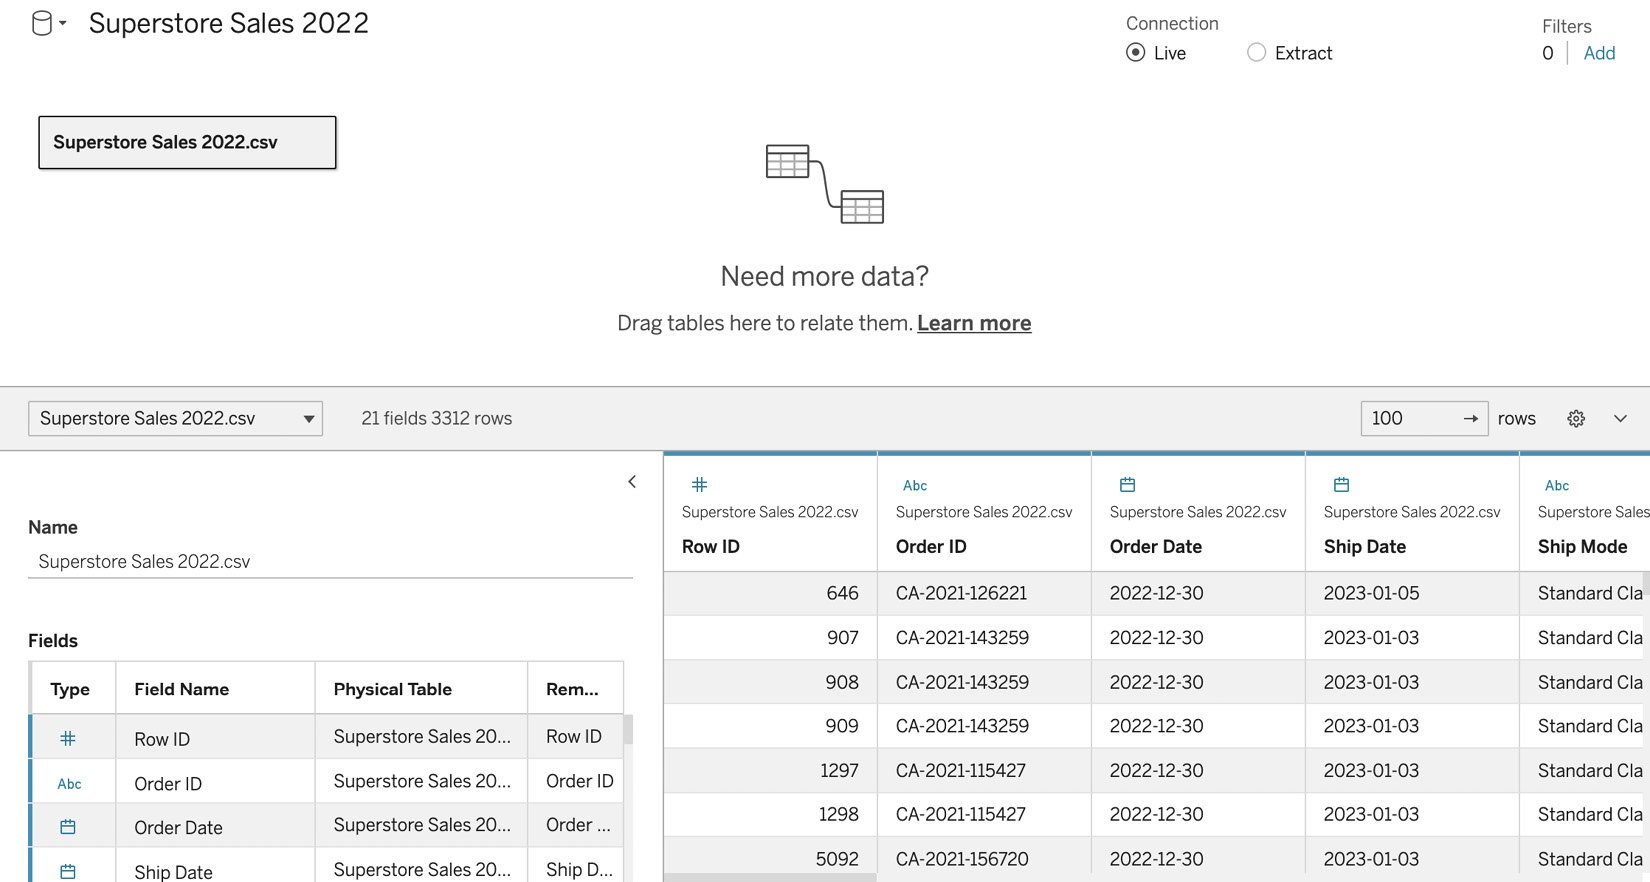
Figure 1.4 – The data pane in Tableau Desktop
The top part of the screen acts as a visual canvas where we can bring in additional data through relationships, joins, and unions. For now, we will look at the bottom part of the screen.
This part of the user interface is broken into two sections. The section on the left displays the metadata for the fields in the data source. The metadata list contains the type, field name, physical table from where the data is being queried, and remote field name.
Type is the Tableau field type, which allows VizQL to guide the analyst to the best visual display for the data. Field Name is Tableau’s attempt to take the remote field name and map it to a business-friendly name. In our dataset, the column names already translate easily to business-friendly names. Imagine if our source file had contained postal_code and not Postal Code in the first row. Tableau would automatically transform postal_code to Postal Code in the field name, making our data modeling job easier for us. We can always change the default name Tableau assigns to any field.
The section to the right contains a sample of data that will be queried, called the Table Details pane. By default, Tableau returns the first 100 rows as a sample. The sample size can be changed in terms of the number of rows to return.
Next up, we will look at what a table format looks like and why it is so important for Tableau.


