


Connecting multiple tables to add new columns
Now that we understand the ideal format of data for Tableau, we can look at ways to expand the size of our data model by connecting to multiple tables. We have connected independently to two different tables in this chapter. We will now combine those tables, along with a third table.
There are two ways in which we can add multiple tables to a single data model. The first is by joining data. We join data when we want to add additional columns to our model for additional context. Think of our sales target data. We want to join that data to our SuperStore sales data to add the additional context of sales targets. That will allow analysts to create views to see how the different categories are performing against their targets.
The second way to add additional data to our model is by adding additional rows (with the same columns). The SuperStore data we used earlier in this chapter was for 2022. What if we wanted to add in sales from 2021? That is where a union would be the answer.
For our next exercise, it should be noted that we are creating a relationship to add the new column and not a join. Using a relationship allows Tableau to create the proper join at runtime based on the data being analyzed. You can think of a relationship as a dynamic, smarter join. We will explore the details and differences between relationships and joins in Chapter 7, Chapter 8, and Chapter 9.
To add the additional column of sales target, we will pick up from the end of the previous exercise:
- Click on the blue Add hyperlink to the right of Connections:
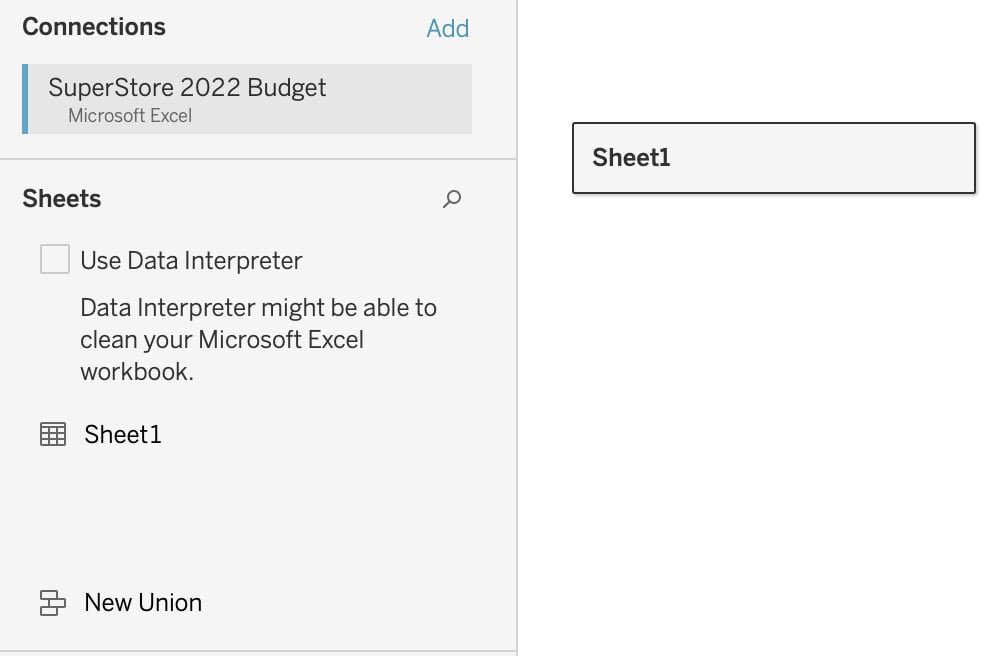
Figure 1.13 – Clicking the Add hyperlink
- Select To a file | Text file |
Superstore Sales 2022.csv| Open. - Under Files, drag
Superstore Sales 2022.csvonto the canvas until the orange noodle shows, and then let go. - At this point, Tableau tries to create a relationship between these tables. Sometimes, Tableau can figure out how to create this relationship. In this case, we can see Tableau was unable to do this from the exclamation mark in a red triangle:
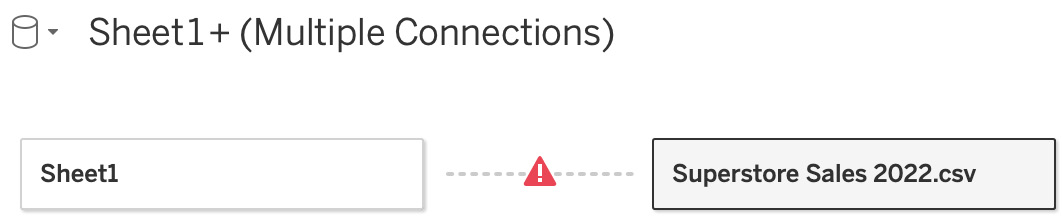
Figure 1.14 – Creating a relationship between two tables
- We need to tell Tableau that the two relationships it should create are Date with Order Date and Category with Category. Let’s relate the two category fields first. We do this by selecting Category and Category1 and making sure the operator is set to equals (=):
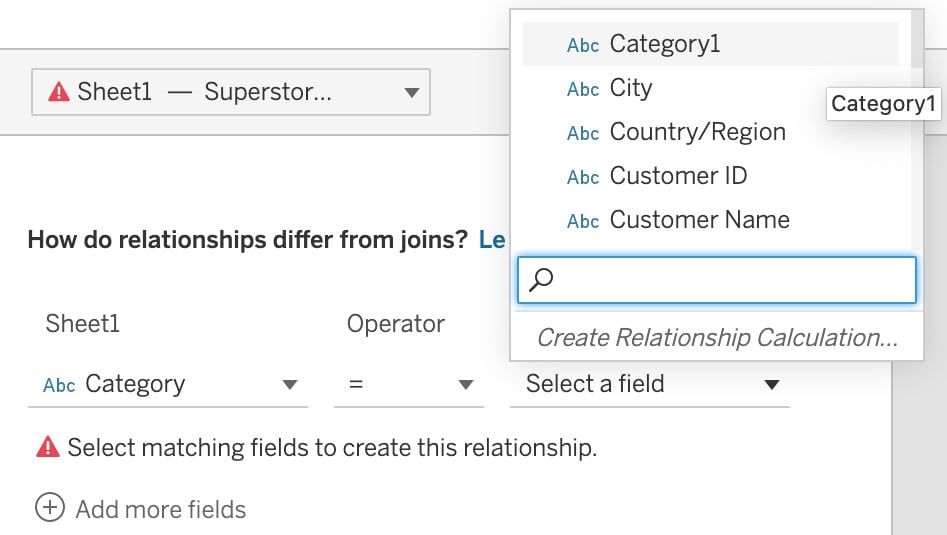
Figure 1.15 – Creating a relationship by linking fields
- To complete the relationship, we will also need to link Date fields to ensure that the sales targets are aligned with the proper dates for analysis. In this specific case, the dates are not at the same grain (one is at the month level and one is at the day level). This will require us to create a relationship calculation, which we will explore in future chapters.
- Now that we have joined additional data sources (tables) to add additional columns for analysis, we will explore adding new rows of data through a union.
- Hover your cursor on the right side of the
Superstore Sales 2022.csvfile rectangle on the canvas, and click on the down arrow when it appears. Select Convert to Union…:
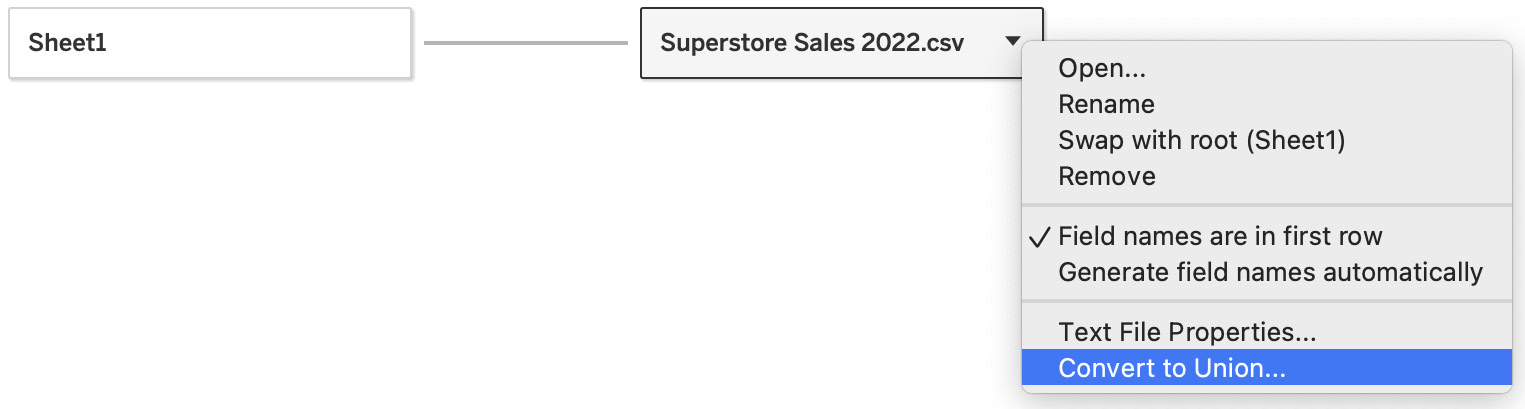
Figure 1.16 – Convert to Union…
- Drag the
Superstore Sales 2021.csvfile from the files section on the canvas into the union dialog box. After clicking OK, all the rows from both 2021 and 2022 will be available for analysis:
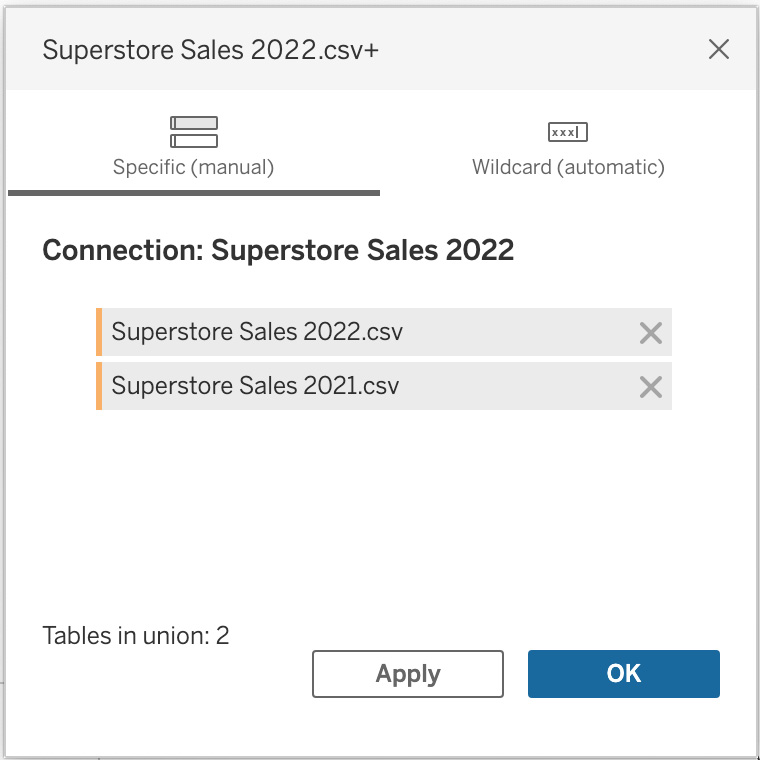
Figure 1.17 – Dragging files to the union dialog box
We have now covered the two core methods of expanding our data model through relationships and unions.


