


Combination Chart
In combination charts, two charts share a dual axis to create one singular chart. These are useful to compare two measures and can allow flexibility in the types of charts that can be used to compare.
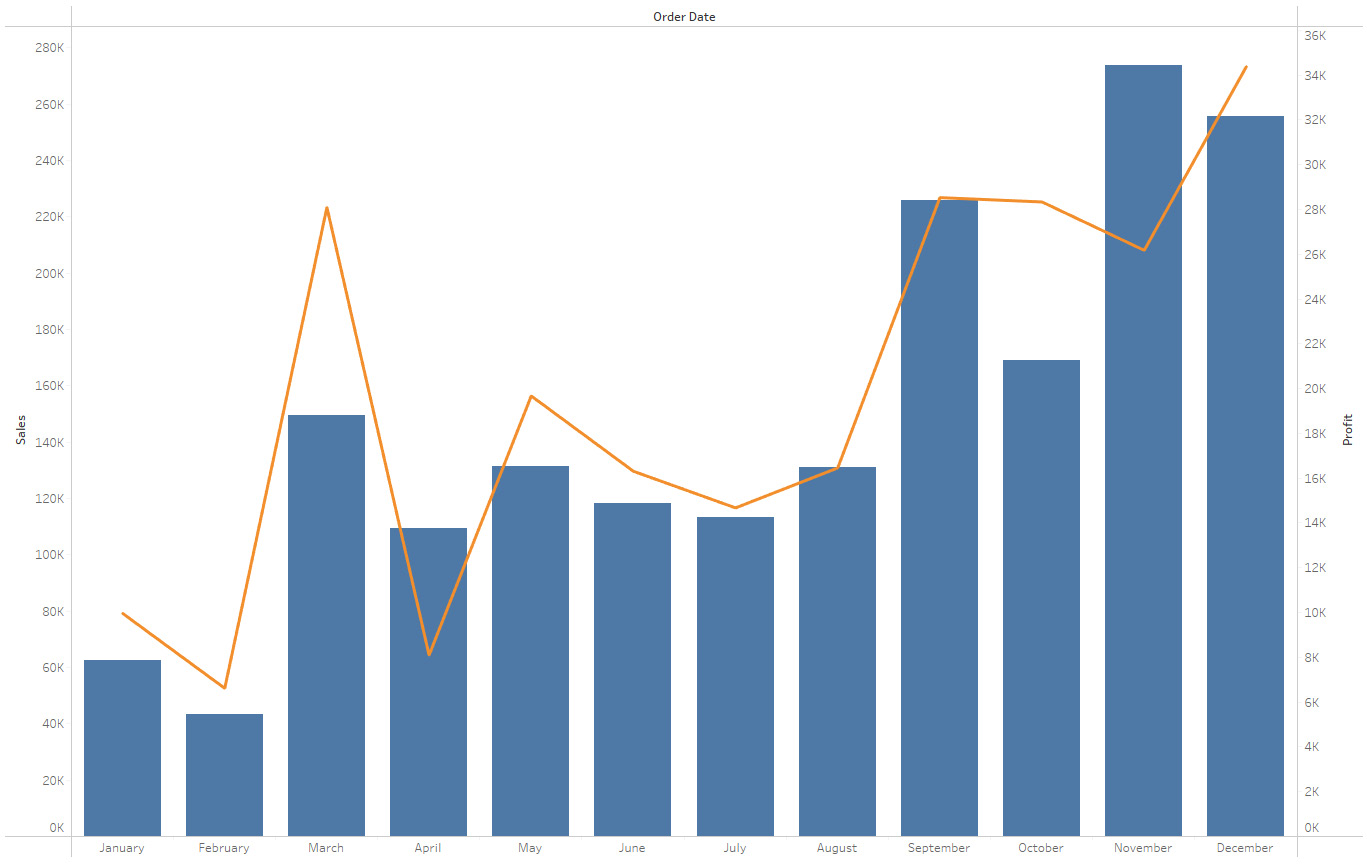
Figure 5.21: Example of a combination chart
Items needed to build this chart are as follows:
|
Columns |
Dimension |
|
Rows |
Two measures that are Dual Axis |
|
Marks |
Depending on the axis |
Table 5.16: Requirements to build a combination chart
Now it is time to build a combination chart. Follow the next steps to see how this chart is built:
- Choose the two measures desired to compare and a dimensional field to break down the view.
- Drag the dimension to Columns.
- Drag the measures next to each other in the Rows shelf.
- This...


