Debugging Svelte applications
Lastly, let's look at how we can debug Svelte applications in a web browser. There are two tools worth highlighting, which can be complementary: using the Visual Studio Code debugger, and using the Svelte DevTools browser extension.
Using the Visual Studio Code debugger
Visual Studio Code contains a powerful debugger that works neatly with web browsers such as Chrome, Firefox, and Edge.
Earlier in the chapter, I recommended installing the free Debugger for Chrome extension from the Visual Studio Code Marketplace (link to the extension in the Visual Studio Marketplace: https://aka.ms/vscode-chrome-debugger). That, or the equivalent for Firefox or Edge, plus a small configuration file is all we need.
Create a configuration file called .vscode/launch.json (note the dot at the beginning of the path) and paste the following content:
.vscode/launch.json
{
    "version": "0.2.0",
    "configurations": [
        {
            "type": "chrome",
            "request": "launch",
            "name": "Launch Chrome against dev server",
            "url": "http://localhost:5000",
            "webRoot": "${workspaceFolder}"
        }
    ]
}
If you're familiar with the Visual Studio Code debugger, you'll notice that this is the standard, autogenerated file, with just the port changed in the URL.
In order to be able to set breakpoints in .svelte files, open the Visual Studio Code settings (File | Preferences, or Code | Preferences on macOS), search for debug.allowBreakpointsEverywhere, and then enable it.
After we've done this, we can use the full debugger, with support for breakpoints, data inspection, logpoints, and so on. To debug a Svelte application, perform the following steps:
- First of all, start the dev server in a terminal; this is the same command we've run before:
$ npm run dev
- Secondly, click the Run icon in the Visual Studio Code activity bar to bring up the debugger and then press the green RUN button:

Figure 2.5 – Clicking on the green RUN button to launch the debugger
Alternatively, you can use the F5 button as a keyboard shortcut.
- Chrome will be launched automatically and will be connected to the debugger in the editor.
Visual Studio Code comes with a very powerful debugger, with support for advanced features, too. The best way to learn how to use the debugger is to check out the official documentation:
https://code.visualstudio.com/docs/editor/debugging
Browser extension
In addition to the debugger inside Visual Studio Code, this community-provided extension for Chrome and Firefox can be useful to inspect and change the state of your Svelte components and troubleshoot issues:
https://github.com/RedHatter/svelte-devtools
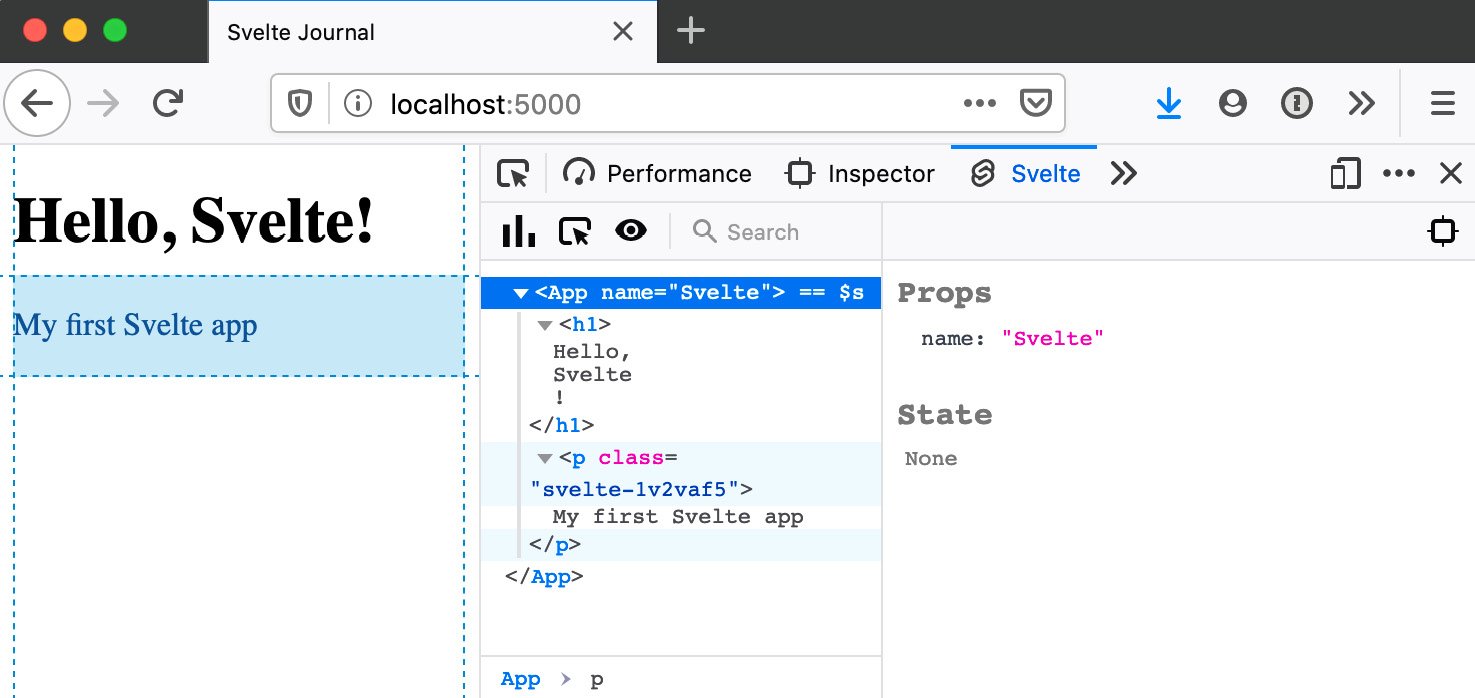
After installing the extension, when you're browsing a Svelte application running in a dev server (for example, our project launched with npm run dev), you will find an extra Svelte tab at the end in your browser's Inspector (also known as Developer Tools):

Figure 2.6 – The Svelte tab in the browser's developer tools
While not a full debugger, this extension shows the Svelte components that are currently rendered in the page, and their current state. You can change the values of props, for example, and see how the content changes.


