Don’t guess, measure!
There is only one way to get a good picture of the fast and slow parts of a program—by measuring it. We can do it manually by inserting time-measuring calls in the code, or we can use specialized tools. We have a name for measuring—profiling—and we call specialized tools for measuring profilers.
In the rest of this chapter, we’ll look at different techniques for measuring the execution speed. First, we will measure the now familiar program, SlowCode, with a simple software stopwatch, and then we’ll look at a few open source and commercial profilers.
Before we start, I’d like to point out a few basic rules that apply to all profiling techniques:
- Always profile without the debugger. The debugger will slow the execution in unexpected places, and that will skew the results. If you are starting your program from the Delphi integrated development environment (IDE), just press Ctrl + Shift + F9 instead of F9.
- Try not to do anything else on the computer while profiling. Other programs will take the CPU away from the measured program, which will make it run slower.
- Take care that the program doesn’t wait for user action (data entry, button click) while profiling. This will completely skew the report.
- Repeat the tests a few times. Execution times will differ because Windows (and any other operating system (OS) that Delphi supports) will always execute other tasks besides running your program.
- All the preceding points especially hold true for multithreaded programs, which is an area explored in Chapters 7 to 10.
Profiling with TStopwatch
Delphi includes a helpful unit called System.Diagnostics, which implements a TStopwatch record. It allows us to measure time events with better precision than 1 millisecond and has a pretty exhaustive public interface, as shown in the following code fragment:
type
  TStopwatch = record
  public
    class function Create: TStopwatch; static;
    class function GetTimeStamp: Int64; static;
    procedure Reset;
    procedure Start;
    class function StartNew: TStopwatch; static;
    procedure Stop;
    property Elapsed: TTimeSpan read GetElapsed;
    property ElapsedMilliseconds: Int64 read
      GetElapsedMilliseconds;
    property ElapsedTicks: Int64 read GetElapsedTicks;
    class property Frequency: Int64 read FFrequency;
    class property IsHighResolution: Boolean read
      FIsHighResolution;
    property IsRunning: Boolean read FRunning;
  end;
To use a stopwatch, you first have to create it. You can call TStopwatch.Create to create a new stopped stopwatch or TStopwatch.StartNew to create a newly started stopwatch. As TStopwatch is implemented as record, there’s no need to destroy a stopwatch object.
When a stopwatch is started, it measures time. To start a stopwatch, call the Start method, and to stop it, call the Stop method. The IsRunning property will tell you whether the stopwatch is currently started. Call the Reset method to reset the stopwatch to zero.
TStopwatch contains a few functions that return the currently measured time. The most precise of them is ElapsedTicks, but as there is no built-in (public) function to convert this into standard time units, this function is hard to use. My recommendation is to just use the ElapsedMilliseconds property, which will give you elapsed (measured) time in milliseconds.
For a simple demo, this code will return 1,000 or a bit more:
function Measure1sec: int64;
var
  sw: TStopwatch;
begin
  sw := TStopwatch.StartNew;
  Sleep(1000);
  Result := sw.ElapsedMilliseconds;
end;
Let’s now use this function to measure the SlowMethod method.
First, you have to add the System.Diagnostics unit to the uses list:
uses
  System.SysUtils,
  System.Generics.Collections,
  System.Classes,
  System.Diagnostics;
Next, you have to create this stopwatch inside SlowMethod, stop it at the end, and write out the elapsed time:
function SlowMethod(highBound: Integer): TArray<Integer>;
var
 // existing variables
 sw: TStopwatch;
begin
  sw := TStopwatch.StartNew;
  // existing code
  sw.Stop;
  Writeln('SlowMethod: ', sw.ElapsedMilliseconds, ' ms');
end;
We can use this code to verify the theory that SlowCode has time complexity O(n2). To do this, we have to measure the execution times for different counts of processed numbers (different values entered at the How many numbers prompt).
I did some testing for selected values from 10,000 to 1,000,000 and got the following numbers:
|
Highest number |
Execution time [ms] |
|
10,000 |
15 |
|
25,000 |
79 |
|
50,000 |
250 |
|
75,000 |
506 |
|
100,000 |
837 |
|
250,000 |
4,515 |
|
500,000 |
15,564 |
|
750,000 |
30,806 |
|
1,000,000 |
54,219 |
Table 2.1 – Measured speed of the SlowCode program
If you repeat the tests, you will, of course, measure different values, but the growth rate should be the same.
For quick confirmation, I have plotted a scatter chart of this data in Excel and the result looks like a square function. To be more sure, I have added a power trendline, which created a function in the form of nc, where c was a constant that Excel calculated from the data. In the case of my specific measurements, this fitting function was y = 10-6 * x1.7751, which is not that far from x2:
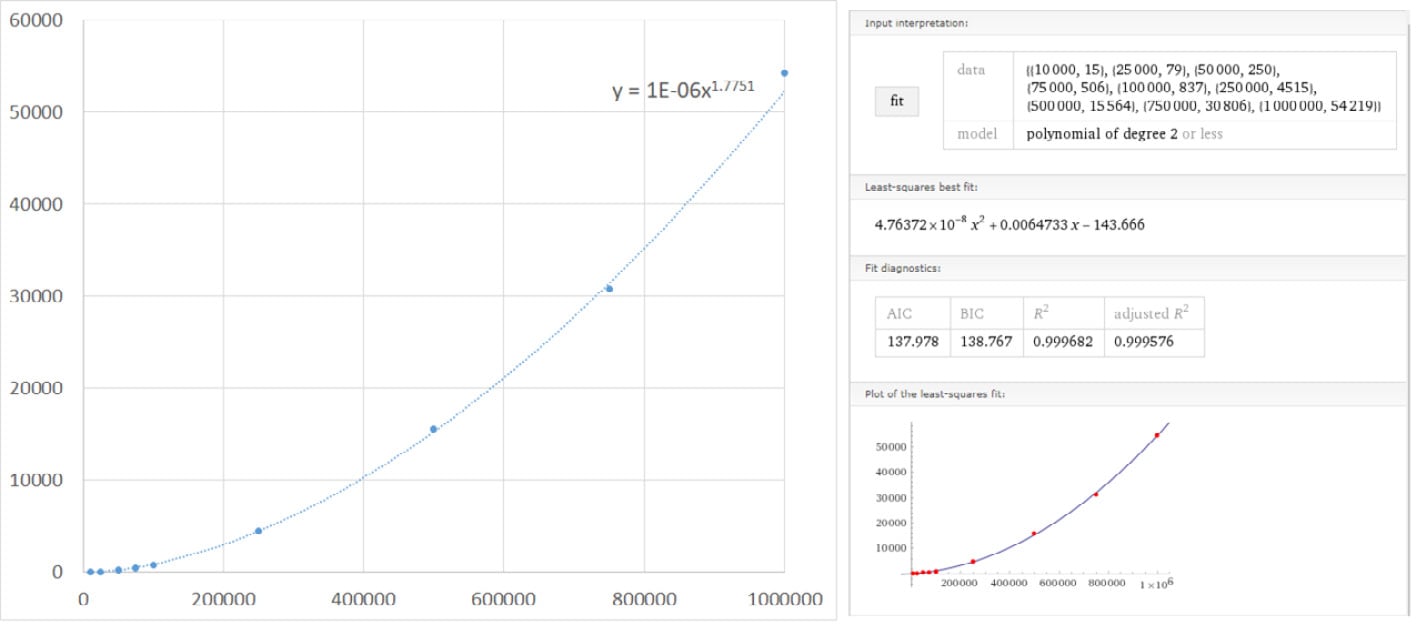
Figure 2.1 – Curve fitting in Excel (left) and Wolfram Alpha (right)
Next, I repeated this curve-fitting process on the wonderful Wolfram Alpha (www.wolframalpha.com), where you can find a regression calculator widget, a tool designed specifically for this task. I entered measurements into the widget, and it calculated a fitting function of 4.76372×10^-8 * x2 + 0.0064733 * x - 143.666. If we ignore all unimportant factors and constants, the only part left is x2. Another confirmation for our analysis!
Now we know how the program behaves in global terms, but we still have no idea of which part of the code is the slowest. To find that out, we also have to measure the execution times of the ElementInDataDivides and Filter methods.
These two methods are called multiple times during the execution of the program, so we can’t just create and destroy a stopwatch each time Filter (for example) is executed. We have to create a global stopwatch, which is a bit inconvenient in this program because we have to introduce a global variable.
If you check the SlowCode_Stopwatch program, you’ll see that it actually creates three global stopwatches, one for each of the functions that we want to measure:
var
  Timing_ElementInData: TStopwatch;
  Timing_Filter: TStopwatch;
  Timing_SlowMethod: TStopwatch;
All three stopwatches are created (but not started!) when the program starts:
Timing_ElementInData := TStopwatch.Create;
Timing_Filter := TStopwatch.Create;
Timing_SlowMethod := TStopwatch.Create;
When the program ends, the code logs the elapsed time for all three stopwatches:
Writeln('Total time spent in SlowMethod: ',
  Timing_SlowMethod.ElapsedMilliseconds, ' ms');
Writeln('Total time spent in ElementInDataDivides: ',
  Timing_ElementInData.ElapsedMilliseconds, ' ms');
Writeln('Total time spent in Filter: ',
  Timing_Filter.ElapsedMilliseconds, ' ms');
In each of the three methods, we only have to start the stopwatch at the beginning and stop it at the end:
function SlowMethod(highBound: Integer): TArray<Integer>;
var
 // existing variables
 sw: TStopwatch;
begin
  sw := TStopwatch.StartNew;
  // existing code
  sw.Stop;
  Writeln('SlowMethod: ', sw.ElapsedMilliseconds, ' ms');
end;
The only tricky part is the ElementInDataDivides function, which calls Exit as soon as one element divides the value parameter. The simplest way to fix that is to wrap the existing code in a try .. finally handler and to stop the stopwatch in the finally part:
function ElementInDataDivides(data: TList<Integer>; value: Integer): boolean;
var
  i: Integer;
begin
  Timing_ElementInData.Start;
  try
    Result := True;
    for i in data do
      if (value <> i) and ((value mod i) = 0) then
        Exit;
    Result := False;
  finally
    Timing_ElementInData.Stop;
  end;
end;
If you run the program and play with it for a while and then exit, you’ll get a performance report. In my case, I got the following result:

Figure 2.2 – Time spent in various parts of the SlowCode program
We now know that most of the time is spent in ElementInDataDivides, but we don’t know how many calls to it were made directly from SlowMethod and how many from the Filter method. To find that out, we have to add two new global variables and some more code:
var
  Generate_ElementInData_ms: int64;
  Filter_ElementInData_ms: int64;
function SlowMethod(highBound: Integer): TArray<Integer>;
var
  i: Integer;
  temp: TList<Integer>;
begin
  Timing_SlowMethod.Start;
  temp := TList<Integer>.Create;
  try
    Timing_ElementInData.Reset;
    for i := 2 to highBound do
      if not ElementInDataDivides(temp, i) then
        temp.Add(i);
    Generate_ElementInData_ms := Generate_ElementInData_ms +
      Timing_ElementInData.ElapsedMilliseconds;
    Timing_ElementInData.Reset;
    Result := Filter(temp);
    Filter_ElementInData_ms := Filter_ElementInData_ms +
      Timing_ElementInData.ElapsedMilliseconds;
  finally
    FreeAndNil(temp);
  end;
  Timing_SlowMethod.Stop;
end;
The code (which can be found in the SlowCode_Stopwatch2 program) now resets the Timing_ElementInData stopwatch before the data generation phase and adds the value of the stopwatch to Generate_ElementInData_ms afterward. Then it resets the stopwatch again for the Filter phase and adds the value of the stopwatch to Filter_ElementInData_ms afterward.
In the end, that will give us the cumulative execution time for ElementInDataDivides called directly from SlowMethod in Generate_ElementInData_ms and the cumulative execution time for ElementInDataDivides called from Filter in Filter_ElementInData_ms.
A test run with an upper bound of 100,000 produced the following output:

Figure 2.3 – Detailed measurements of the SlowCode execution time
Now we can be really sure that almost all the time is spent in ElementInDataDivides. We also know that approximately 75% of the time, it is called directly from SlowMethod and 25% of the time from the Filter method.
We are now ready to optimize the program. We can either improve the implementation to make it faster, replace it with a faster algorithm, or both.
Profilers
Measuring the speed of a program by inserting special code into the program by hand is perfect if you want to measure a very specific part of the code, but it becomes cumbersome if you don’t know exactly which part of the program you should focus on. In such cases, it is best to use specialized software: profilers.
Profilers can measure all kinds of parameters. Sure, they are mostly used for measuring execution speed, at a method or even on a line level, but they can do much more. They can display the call tree—a graph showing how methods call one another. They can show memory usage in a program so you can quickly find the one method constantly eating the memory. They can show you the coverage of your tests so you can see which code was tested and which was not. And much more.
They do that magic in two ways: sampling or instrumentation.
The sampling profiler looks at the state of your program at regular intervals (for example, 100 times per second) and, each time, checks which line of the code is currently being executed. Statistically, it will predominantly see lines of code that are executed most of the time.
Sampling profiling will give us only a rough overview of behavior inside the program, but it will do that without affecting the program speed, and because of that, it is excellent for taking a first look at some code.
Instrumenting profilers do their magic by changing—instrumenting—the code. They, in fact, do almost exactly the same kind of changing the code as we did by inserting the stopwatch calls.
There are two ways to perform instrumentation. A profiler can change the source code, or it can change the program binary. Source instrumenting profilers are rare because they are less safe to use (there’s always the possibility that a profiler will mess up the source) and because you have to recompile the code after it is instrumented (modified by the profiler).
Most of the instrumenting profilers on the market modify the binary code, which is a bit trickier to implement but doesn’t require recompilation and cannot destroy the source code.
The advantage of instrumentation over sampling is that the former can collect everything that is going on inside the program and not just a few samples here and there. The disadvantage is that instrumentation reduces the speed of the program. Although instrumenting profilers take extra care to optimize the code that is inserted into your program, executing this code in many instrumented methods can still take a long time.
The other problem is the amount of collected data. A short and fast method called 100,000 times in 1 second will generate 100,000 data samples in an instrumenting profiler and only 100 samples in a sampling profiler (provided that it samples the code 100 times a second).
Because of all that, instrumenting profilers are best used once we already know which part(s) of the program we want to focus on.
I’ll end this chapter with an overview of four profilers, two are open source and free (AsmProfiler and Sampling Profiler) and two are commercial (AQTime and Nexus Quality Suite (NQS)), to make it easier for you to choose the best fit for your situation. These four profilers are, of course, not your only options. If you need very precise profiling of short methods, check out ProDelphi (https://www.prodelphi.de). And if you need a high-end tool that will not only profile your application but help optimize it to its fullest potential, take a look at Intel’s VTune Amplifier (https://www.intel.com/content/www/us/en/developer/tools/oneapi/vtune-profiler.html).
AsmProfiler
AsmProfiler is a 32-bit instrumenting and sampling profiler written by André Mussche. Its source, along with the Windows exe, can be found at https://github.com/andremussche/asmprofiler. Although the latest version was released in 2019, it works well with the newest Delphi at the time of writing this book, 11.3 Alexandria.
The sampling and instrumenting profilers are used in different ways, so I’ll cover them separately.
To use AsmProfiler, you first have to unpack the release ZIP into a folder on your disk. That will create two subfolders—Sampling and Instrumenting. To start the sampling profiler, start AsmProfiling_Sampling from the Sampling folder and then click Start profiling.
AsmProfiler has two ways of starting a profiling session. You can start the program manually by clicking Select process in AsmProfiler and selecting your program from the list of running processes. Alternatively, you can click Select exe, browse to the compiled EXE of your program, and then click Start process now, which will start the program, or click Start sampling, which will start the program and also start sampling the code.
The reasoning behind the two different ways of starting the program is that you mostly want to profile a specific part of the program, so you would load it into the profiler, navigate to the specific part, click Start sampling, do the required steps in your program, click Stop sampling, and analyze the results. Sometimes, however, you would want to profile the very startup of the program, so you want sampling to start immediately after your program is launched. The following screenshot shows the initial AsmProfiler screen:
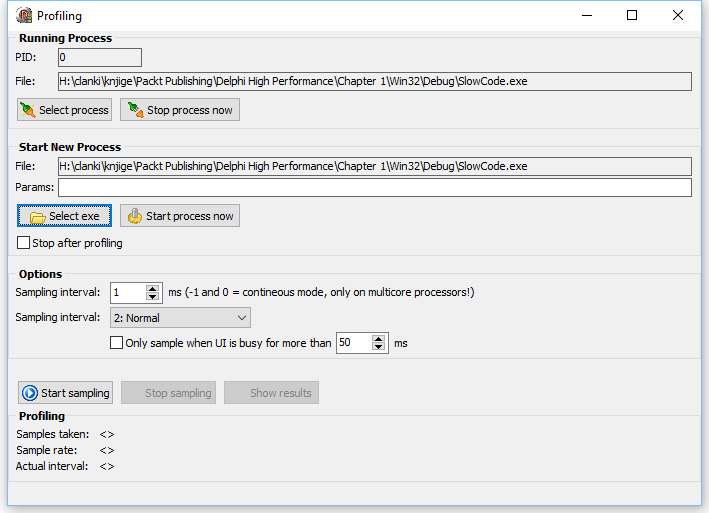
Figure 2.4 – Starting the profiling session in AsmProfiler
Sampling options can be configured in the Options group. You can set the Sampling interval value—how many milliseconds will pass between two samples. Setting this value to 4, for example, will generate 250 (1000/4) samples per second.
Setting the sampling interval to 0 enables a continuous sampling mode, which still leaves some time for threads running on the same CPU. (The sampling code calls Sleep(0) between taking two samples.) Setting it to -1 causes the samples to be taken as fast as possible. In effect, AsmProfiler will use one CPU core for itself.
You can also set the priority of sample-taking threads from the default, Normal. I will discuss threads and priorities in Chapter 7, Getting Started with the Parallel World.
After you have taken the samples and clicked Stop sampling, click the Show results button to analyze the results.
If you want to compare your results with mine, here are the steps to produce the results (as shown in the following screenshot):
- Start AsmProfiler.
- Click Select exe and select SlowCode.exe.
- Click Start process now.
- Click Start sampling.
- Enter
100,000into the program. - Click Stop sampling.
- Enter
0into the program to exit. - Click Show results.
- Click Results on the Sampling Results form:
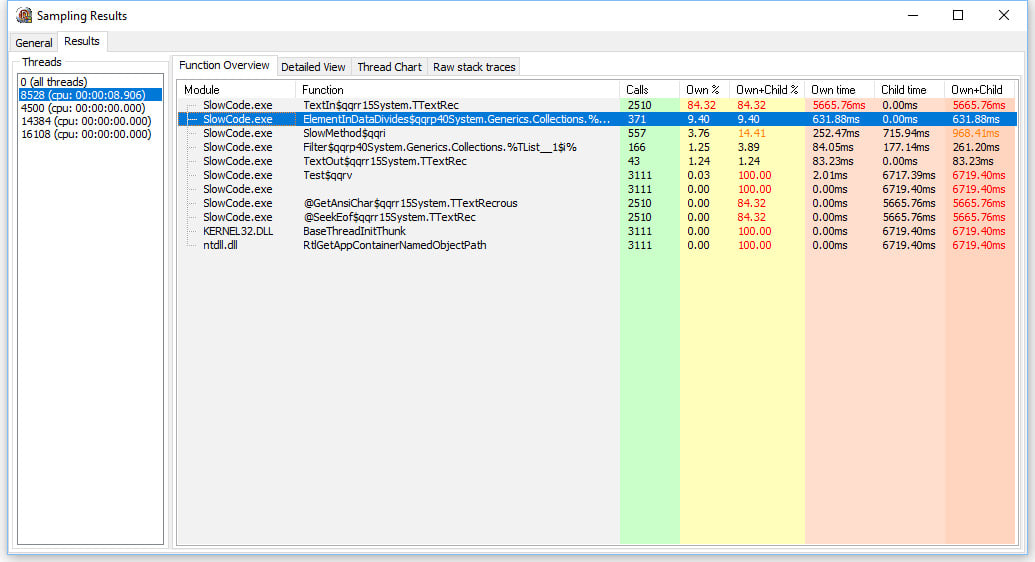
Figure 2.5 – The result of a test run profiled with AsmProfiler’s Sampling profiler
AsmProfiler displays results organized by threads, but it automatically highlights the main thread, so you don’t have to care about that detail if your program doesn’t use multithreading.
In the result grid, it shows the module (main EXE or DLL), the name of the function, how many times the code was found to be in this function, and how many times (absolute and percentage) the code spent in that function (Own time), in all functions called from it (Child time), and both in that function and in all functions called from it (Own+Child).
If we sort results by the time spent only in the function (Own time), we’ll see that the TextIn$qqrr15System.TTextRec function comes to the top. This a function that reads console input (in the Readln statement) and we can safely ignore it.
The next one on the list, ElementInDataDivides$qqrp40..., is the one that interests us.
We can see that it was sampled 371 times (calls) and that it needed 0.6 seconds to execute. If you switch to the Detailed View tab and select this function, you’ll see in the Parent calls (called by ...) panel that it was called 258 times from SlowMethod and 113 times from the Filter method. In reality, of course, it was called many more times, but most of them were not seen by the sampling profiler.
In this view, we can also see how many times each line of a method was hit, which will give us a good idea about where the program spends most of the time. Unfortunately, we cannot sort the data on different criteria:
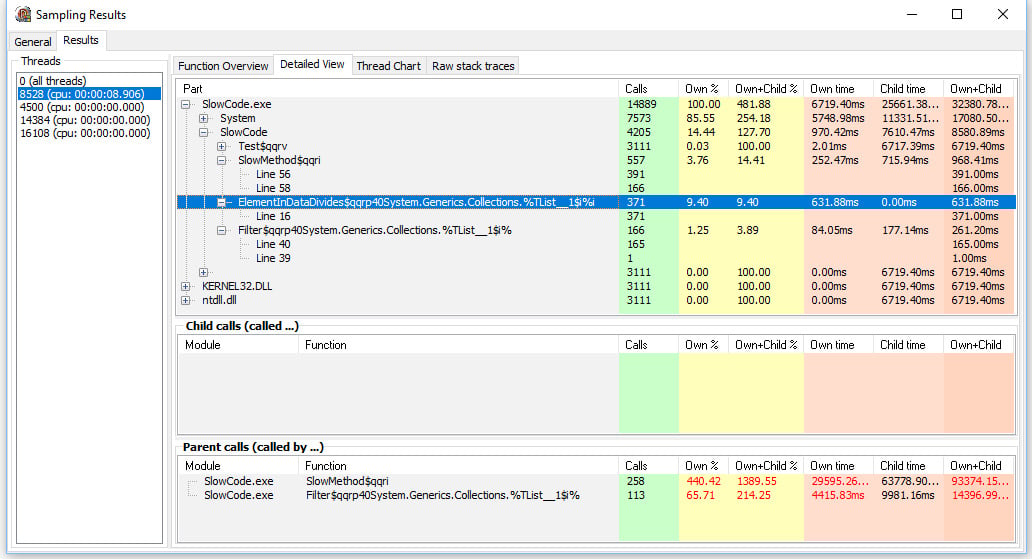
Figure 2.6 – A detailed view showing information for each line of the program
The names of the methods in these outputs are very weird, but that is how the Delphi compiler calls these methods internally. The part after the $ character encodes the parameter types. This process is called name mangling (and the part after $ is sometimes referred to as a decoration), and it enables us to use overloaded methods with the same name and different parameters—internally, they all have different names.
For example, the SlowMethod(highBound: Integer) function is internally known as SlowMethod$qqri. The qqr part specifies the fastcall calling convention (it describes how parameters are passed to the function in registers and on the stack), and i identifies one integer parameter.
AsmProfiler’s instrumenting profiler requires a bit more work. First, you have to copy AsmProfiler.dll from the Instrumenting subfolder into a folder on the Windows environment path or into the exe folder. Second, you have to copy Instrumenting\API\_uAsmProfDllLoader.pas into Delphi’s library path, into your project’s folder, or add this folder to your project’s search path.
Third, you have to add the _uAsmProfDllLoader unit to your project and call the following code. This will show the profiler’s main form on the screen:
if _uAsmProfDllLoader.LoadProfilerDll then
  _uAsmProfDllLoader.ShowProfileForm;
To start profiling, call _uAsmProfDllLoader.StartProfiler(False). To stop collecting data, call _uAsmProfDllLoader.StopProfiler. These two calls are not strictly necessary. You can also start and stop profiling from the profiler’s user interface. Modifying the code will, however, give you more control over the profiling process.
Before your program exits, unload the profiler DLL with _uAsmProfDllLoader.UnLoadProfilerDll.
Make sure that your program has the following compiler options correctly set:
- Linker, Map file = detailed
- Compiler, Optimization = off
- Compiler, Stack frames = on
If you are using Delphi 11, you will also have to disable following linker options:
- Data Execution Prevention compatible = off
- Support address space layout randomization (ASLR) = off
The instrumenting profiler requires your program to process messages, making it mostly useless when used in Mr. Smith’s program, as it spends most of the time inside a Readln call (and is not processing messages). As I still wanted to show you how this profiler works, I have converted SlowCode into a more modern VCL version, SlowCode_VCL.
At first, I wanted to start/stop profiling right in SlowMethod:
function TfrmSlowCode.SlowMethod(highBound: Integer): TArray<Integer>;
var
  i: Integer;
  temp: TList<Integer>;
begin
  _uAsmProfDllLoader.StartProfiler(False);
  // existing code
  _uAsmProfDllLoader.StopProfiler;
end;
However, that attempt misfired, as AsmProfiler didn’t want to show profiling results for SlowCode. It turned out to be better to move the start/stop calls out of this method and into the method that calls SlowCode:
procedure TfrmSlowCode.btnTestClick(Sender: TObject);
var
  data: TArray<Integer>;
begin
  outResults.Text := '';
  outResults.Update;
  _uAsmProfDllLoader.StartProfiler(False);
  data := SlowMethod(inpHowMany.Value);
  _uAsmProfDllLoader.StopProfiler;
  ShowElements(data);
end;
A version of the program, ready for profiling with AsmProfiler, is stored in the SlowCode_VCL_Instrumented project. You will still have to download AsmProfiler and store AsmProfiler.dll and _uAsmProfDllLoader.pas in appropriate places.
When you start the program, a small form will appear alongside the program’s main form. From here, you can start and stop profiling, select items (methods) that should be profiled (Select items), and open the results of the profiling session (Show results):
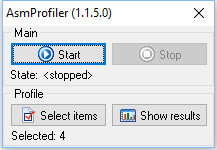
Figure 2.7 – AsmProfiler’s instrumenting profiler
We are interested only in three methods, so click the Select items button, select the ElementInDataDivides, Filter, and SlowMethod methods, and click OK:
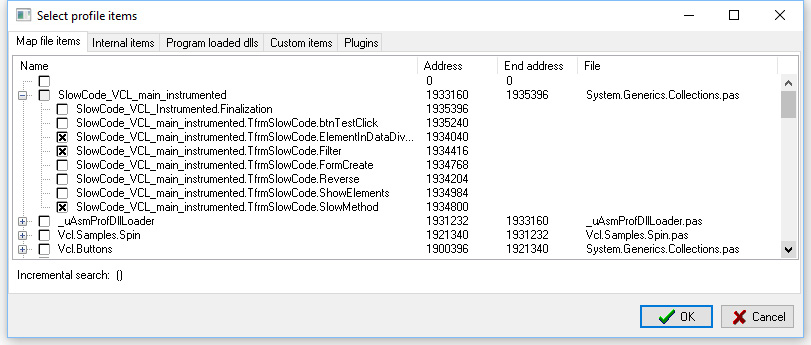
Figure 2.8 – Selecting the methods to be profiled
Next, enter 100000 into the How many numbers field and click the Test button. You don’t have to start and stop the profiler, as the program will do that. When the values are calculated and displayed on the screen, click the Show results button. Don’t close the profiled program, as that would close the profiler form, too.
The results form of the instrumenting profiler is very similar to the equivalent form of the sampling profiler. The most interesting feature is the Unit overview tab, which combines detailed timing information and a call tree:
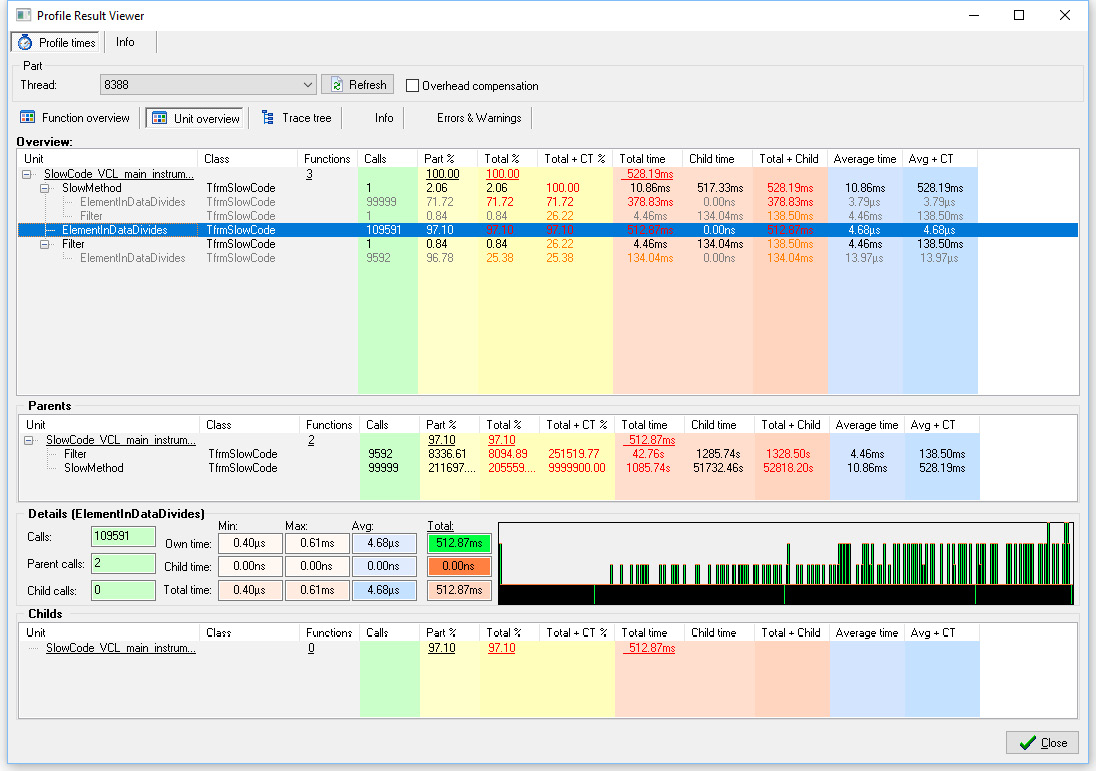
Figure 2.9 – The Unit overview display
We can see that ElementInDataDivides is, in fact, called 99,999 times directly from SlowMethod and only 9592 times from the Filter method, not 258 and 113 times, as shown by the sampling profiler.
AsmProfiler gives a good combination of a global overview and detailed analysis, although it is rough around the edges and requires more effort on your part than more polished commercial profilers.
Sampling Profiler
Sampling Profiler is, as its name suggests, a sampling profiler for Delphi, written by Eric Grange. You can find it at https://www.delphitools.info. After years of inactivity, it was updated in 2023 and now officially supports all modern Delphis. It supports both 32- and 64-bit applications.
The strongest part of Sampling Profiler is its ability to be configured for multithreaded sampling. You can specify which CPUs will execute the profiler and which CPUs will run the profiled application. You can also focus on a specific thread by issuing a OutputDebugString('SAMPLING THREAD threadID') command from your code (replace threadID with the real ID of the thread you want to profile). It is also very simple to turn profiling on or off by calling OutputDebugString('SAMPLING ON') and OutputDebugString('SAMPLING OFF').
An interesting feature of Sampling Profiler, which other profilers don’t provide, is the ability to enable a web server in the profiler. After that, we can use a browser to connect to the profiler (if firewalls allow us, of course), and we get an instant insight into the currently most executed lines of our program:
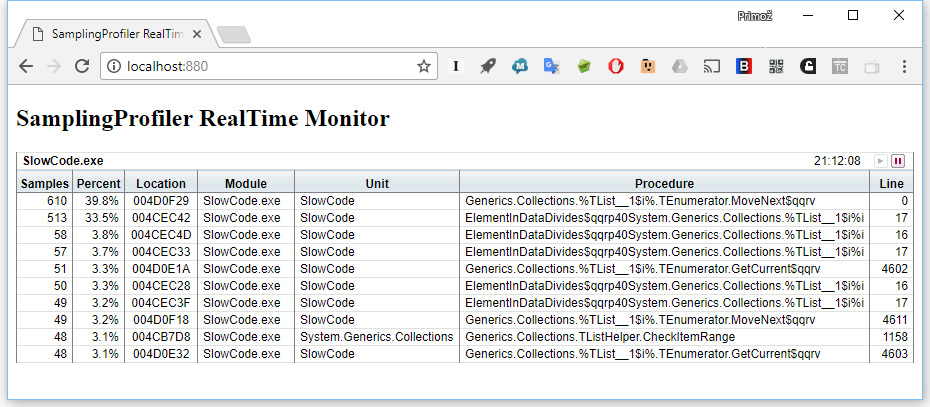
Figure 2.10 – A live status view from a remote location
The weakest point of Sampling Profiler is its complete inability to select methods that are of interest to us. As we can see in the following screenshot, we get some methods from System.Generics.Collections mixed between methods from SlowCode. This only distracts us from our task—trying to find the slow parts of SlowCode.
Saying all that, I must admit that the display of profiling results is really neatly implemented. The results view is simple, clean, and easy to use:
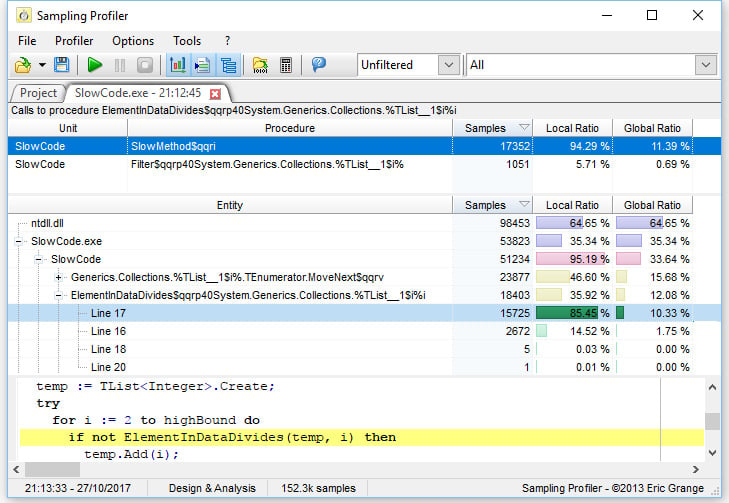
Figure 2.11 – The simple and effective result view
Sampling Profiler would be a perfect solution for occasional profiling if it would only allow us to select topics of interest.
AQTime
AQTime is a performance and memory profiler for C/C++, Delphi, .NET, Java, and Silverlight, produced by SmartBear Software. It supports 32- and 64-bit applications and can be found at https://www.smartbear.com.
Previously, a special Standard version of AQTime was included with RAD Studio, C++Builder, and Delphi. This offer was only available for releases XE to XE8 and the licensing was not renewed after that. If you want to use AQTime with any other Delphi release, you have to buy AQTime Professional.
For testing purposes, you can install a trial version of AQTime Professional, which will only run for six days. Dedicate some time to testing and use it wisely!
AQTime Professional supports all Delphi versions from 2006 to 10.4 Sydney, and you can even use it in Visual Studio, which is a great plus for multiplatform developers. It contains a variety of profilers—from the performance profiler (binary instrumenting profiler) and the sampling profiler to the coverage profiler (to see which parts of the program were executed) and more specific tools such as BDE SQL profiler, static analysis (a code analysis tool, which is not really a profiler), and more.
It integrates nicely into the Delphi IDE, but you can also use it as a standalone application. That gives you more flexibility during the profiling and result analysis, and that’s why I also used the standalone AQTime Professional for the examples. Version 8 (current at the time of writing) does not integrate with the Delphi 11 IDE, but you can still profile Delphi 11 programs with the standalone profiler.
To prepare your program for profiling, make sure that the following compiler options are set:
- Compiler, Stack frames = on
- Compiler, Debug information = Debug information
- Compiler, Local symbols = true
- Linker, Debug information = true
In order for AQTime to be able to find the source file for your project, you have to specify a search path. Go to Options | Options, then select General | Search directory, and add all the folders with your source files.
Next, you can choose to profile all units, but unless you are using a sampling profiler, this will slow down the execution in a typical program a lot. It is better to select just a few units or, as in our example, just a few methods.
The easiest way to do that is to create a new profiling area, and the easiest way to do that is to select one or more methods in the left tree (use Shift + click and Ctrl + click), then right-click and select Add selected to | New profiling area. After that, you can add additional methods to that profiling area by right-clicking and selecting Add selected to | Existing profiling area or simply with drag-and-drop.
When creating a new profiling area, you also have to choose whether to profile on a method or on a line level by checking or unchecking the Collect info about lines checkbox:
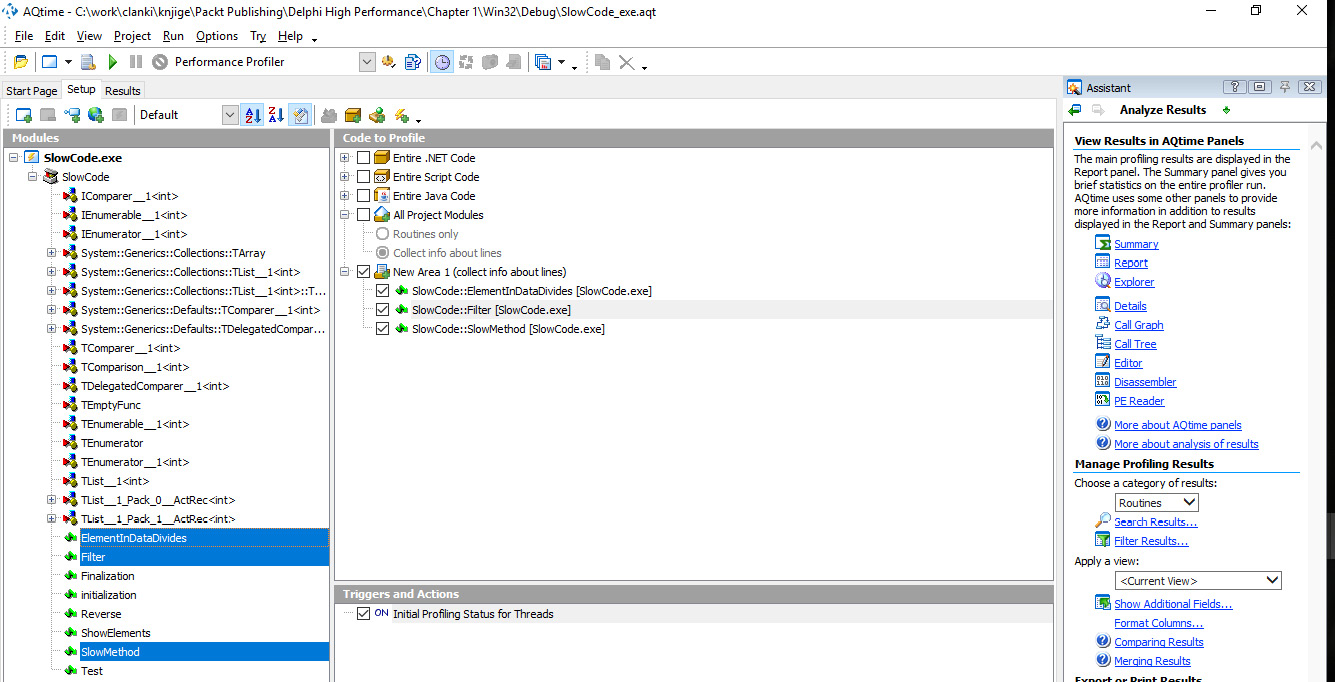
Figure 2.12 – Creating a new profiling area
Then start the program from AQTime—or select the AQTime | Run with profiling menu from Delphi, do the necessary steps you want to profile, and exit. AQTime will show the profiling results. Similar to all other profilers, it will show a grid with measured methods, the net time spent in each, time with children, and a hit count indicator—an indicator showing how many times the method executed.
More interesting info is hiding in the lower panel. There is a very detailed call graph, which displays a call tree for the selected method, and a very useful Editor panel, which shows the source together with the hit count information for each line:
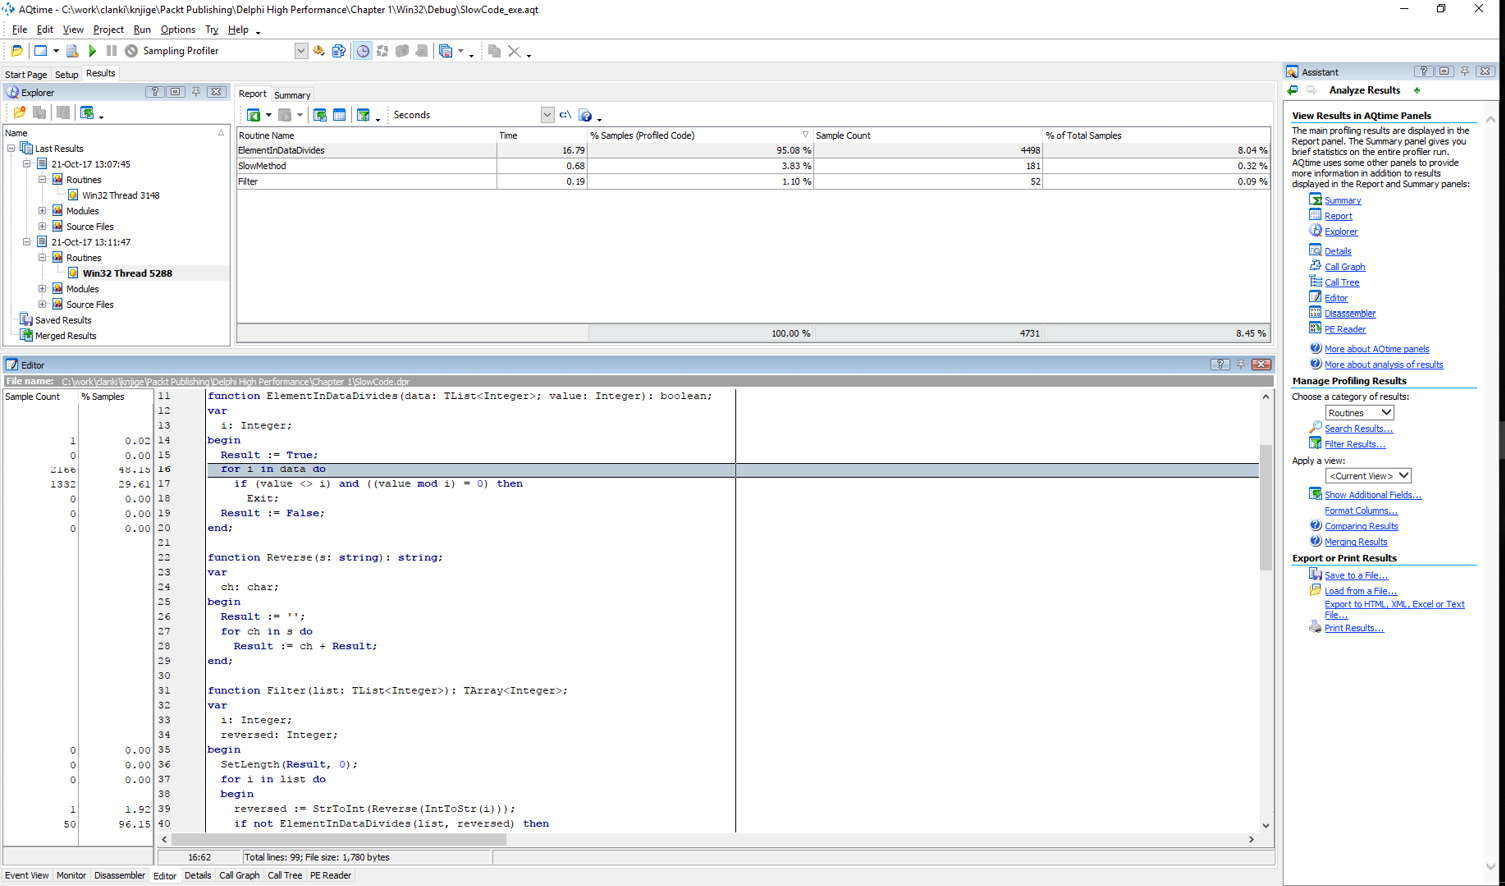
Figure 2.13 – The Editor view showing the hit count for instrumented methods
AQTime is a great tool, provided that you stay away from the very limited Standard edition and go directly for Professional.
The Nexus Quality Suite
NQS is a successor to the long-defunct TurboPower’s SleuthQA, published by NexusQA Pty Ltd. It supports 32- and 64-bit applications written in Delphi from 5 to 11.3 Alexandria. You can find it at www.nexusdb.com.
The trial version has fewer limitations than AQTime’s. Some functions are disabled, and some are limited in the quantity of collected data. Still, the program is not so limited that you wouldn’t be able to test it out.
NQS integrates into Delphi’s Tools menu and extends it with all the profilers it brings to Delphi. Of the most interest to us are Method Timer, an instrumenting profiler working at a method level, and Line Timer, an instrumenting profiler working at a line level. There is also Block Timer, an instrumenting profiler working on a block level (a for loop, for example), which was not working correctly at the time of writing this book and so I wasn’t able to test it. That’s really bad luck, as there are no other profilers for Delphi that work on a block level, and it would be really interesting to compare it with more standard approaches.
A few other tools are also interesting from the profiling viewpoint. Coverage Analyst will help you analyze code coverage, which is an important part of unit testing. After all, you definitely want to know whether your unit tests test all of the methods in a unit or not.
Also interesting is CodeWatch, which hunts for bugs in code by looking for memory and resource leaks.
All these profilers, with the exception of CodeWatch, are available in 32-bit and 64-bit versions, although the 64-bit operation is not as stable as in the 32-bit counterparts. I was only able to use Line Timer in 32-bit mode, for example, while Method Timer worked flawlessly in 32-bit and 64-bit modes.
Both Method Timer and Line Timer require no special preparation. You just have to have debug information turned on in the linker options.
When you start Method Timer, a profiler window opens. Click on the Routines button to select methods to profile. To change the profiling status of a method, double-click its name or right-click and select Profile Status | Enable Profile Status For Selected.
When you are done, press F9 to start the program, go through the steps that you want to profile, and exit the program.
The program will then display basic timing information, including net time per method and gross time (what other programs call “time with children”). If you click on a method, the lower two panes will display information about the methods that called the current method and the methods that were called from the current method.
If you double-click on a method, another window will appear showing the source code for the selected method but without any information about the profiling results:
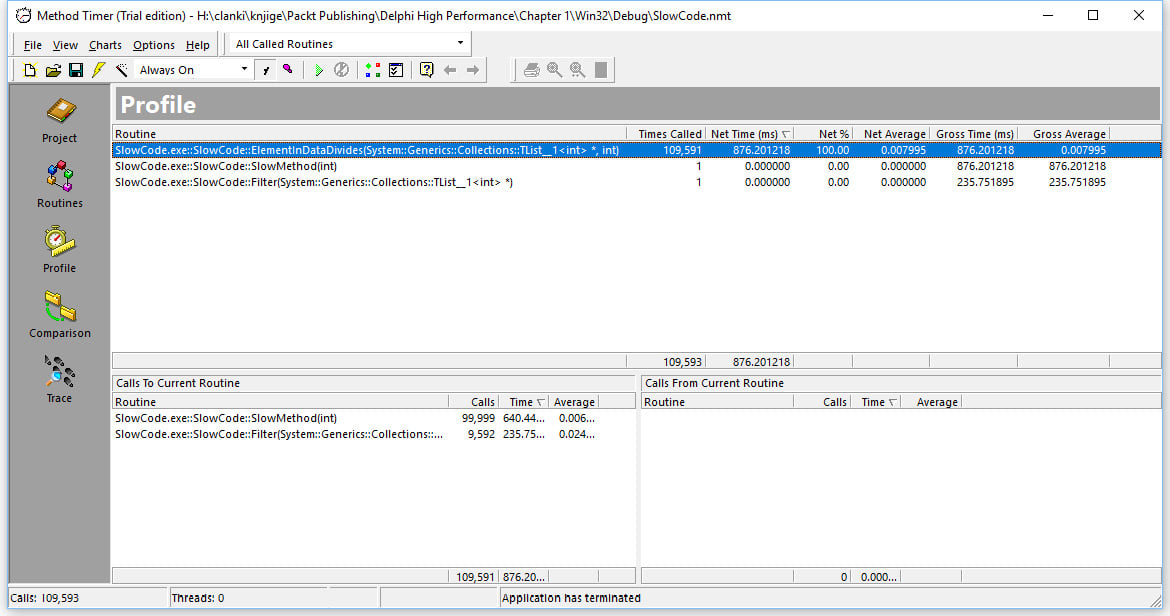
Figure 2.14 – The Method Timer results window
Line Timer has a similar user interface. First, you select the methods to be profiled in the Routines view, then you run the program, and at the end, examine the results in the Line Times window.
This profiler has a display that is a bit different from other profilers that support line-level profiling. It is not grouped by methods but by line numbers. This gives us an immediate overview of the most critical part of the code but is hard to integrate into a bigger picture.
As in Method Timer, a double-click on a line in the results grid opens up an editor window that displays the source code, together with the time spent in each profiled line and the number of times this line was executed:
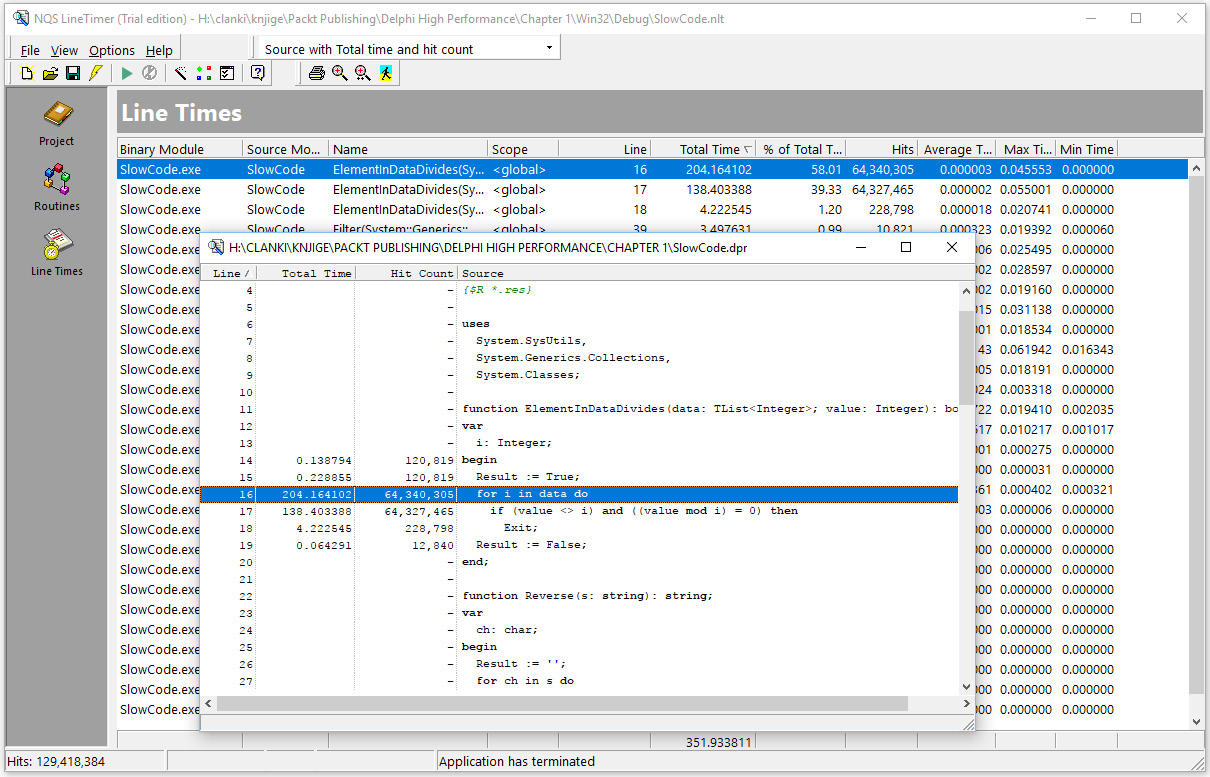
Figure 2.15 – Line Timer with built-in code display
NQS is a nice set of tools, and we can only hope that its stability improves with future releases.


