Search icon CANCEL
Subscription
0
Cart icon
Your Cart (0 item)
Close icon
You have no products in your basket yet
Save more on your purchases! discount-offer-chevron-icon
Savings automatically calculated. No voucher code required.
Arrow left icon
Explore Products
Best Sellers
New Releases
Books
Videos
Audiobooks
Learning Hub
Free Learning
Arrow right icon
Arrow up icon
GO TO TOP
Creative Motion Mastery with Adobe After Effects

You're reading from   Creative Motion Mastery with Adobe After Effects Learn the ins and outs of motion graphics, post-production, rotoscoping, and VFX

Arrow left icon
Product type Paperback
Published in Feb 2024
Publisher Packt
ISBN-13 9781804617281
Length 332 pages
Edition 1st Edition
Arrow right icon
Author (1):
Arrow left icon
Vishu Aggarwal Vishu Aggarwal
Author Profile Icon Vishu Aggarwal
Vishu Aggarwal
Arrow right icon
View More author details
Toc

Table of Contents (18) Chapters Close

Preface 1. Part 1: Working with Motion Graphics
2. Chapter 1: Getting to Know the User Interface and Workflow FREE CHAPTER 3. Chapter 2: Applying Effects and Presets to Create Animated Graphics 4. Chapter 3: Deep-Dive into Text Animations 5. Chapter 4: Animating Shape Layers 6. Chapter 5: Adding Motion to Photoshop and Illustrator Graphics 7. Chapter 6: Creating Motion Graphic Templates for Premiere Pro 8. Part 2: Post-Production and Visual Effects
9. Chapter 7: Color Correction and Color Grading 10. Chapter 8: Rotoscoping and Mask Tracking Techniques 11. Chapter 9: Chroma Keying 12. Chapter 10: Working with Particle Simulations 13. Part 3: 2D and 3D Tracking, and Rendering
14. Chapter 11: Working with 2D and 3D Tracking 15. Chapter 12: Exporting and Managing Projects 16. Index 17. Other Books You May Enjoy

Creating a bar graph line

We will create a graph line using the Pen tool to indicate the graph values from 2020 to 2026. The Pen tool is a great tool for creating custom shapes and Bezier paths.

Follow these steps to create the bar graph line:

  1. Select the Pen tool in the Tools panel and make sure Fill is set to None, Stroke is a white color, and the Stroke value is 10.
Figure 4.38: Pen tool settings

Figure 4.38: Pen tool settings

  1. Now, make sure that no layer is selected in the Composition panel, then click on the bottom of the 2020 bar. We create a vertex point on the 2020 bar and place vertex points on all the years’ bars going from top to bottom and again from bottom to top. This depicts that the graph is sometimes going up and sometimes down, which is how a statistical graph naturally is. This is shown in Figure 4.39. Rename the layer Graph Line.
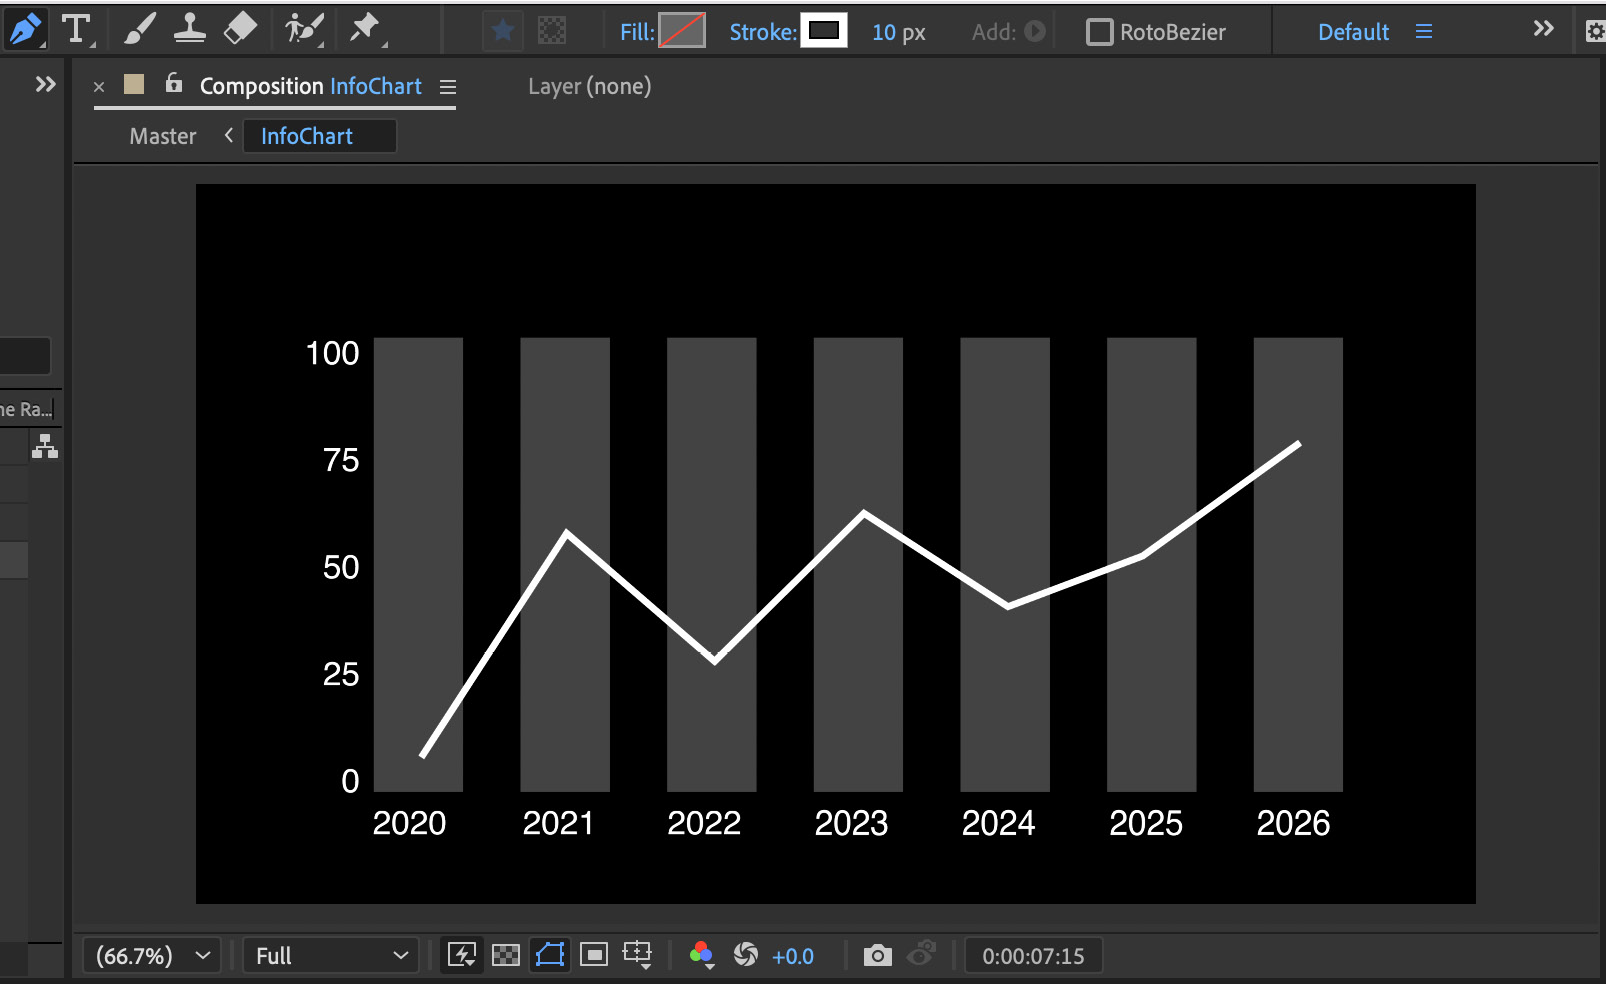
Figure 4.39: Graph Line created using the Pen tool

Figure 4.39: Graph Line created using the Pen tool

  1. Go to the Elliptical...
lock icon The rest of the chapter is locked
Register for a free Packt account to unlock a world of extra content!
A free Packt account unlocks extra newsletters, articles, discounted offers, and much more. Start advancing your knowledge today.
Unlock this book and the full library FREE for 7 days
Get unlimited access to 7000+ expert-authored eBooks and videos courses covering every tech area you can think of
Renews at $19.99/month. Cancel anytime
Banner background image