Working with Web Map Service (WMS)
Another way to change the appearance of maps is to connect to a service called Web Map Service, which serves map tiles, and use those instead of the default maps the come with Tableau.
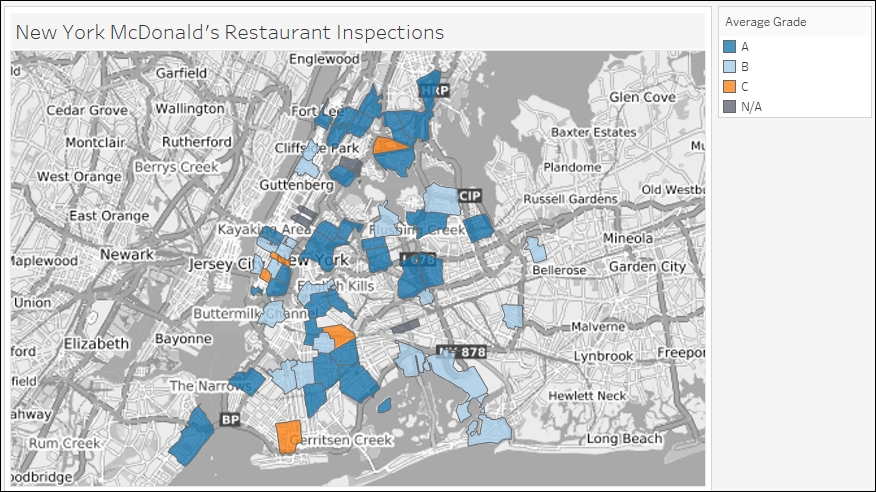
In this recipe, we are going to plot some areas based on zip code and provide a map background based on a web map service:

Getting ready
To follow this recipe, open B05527_05 – STARTER.twbx. Use the worksheet called WMS, and connect to the DOHMH New York City Restaurant data source:

How to do it...
Here are the steps to create a map with a WMS background:
From Dimensions in the side bar, drag DBA to the Filters shelf and filter the values to only show MCDONALD'S.
In the Dimensions section, double-click on Zipcode. This will show the Tableau default map in the view.
From Dimensions, drag DBA to Details in the Marks card. This will update the map with circles representing locations of the McDonald's restaurants.
Click on the Map menu, and select Map Services…:

In the Map Services window...


