Search icon CANCEL
Subscription
0
Cart icon
Your Cart (0 item)
Close icon
You have no products in your basket yet
Save more on your purchases! discount-offer-chevron-icon
Savings automatically calculated. No voucher code required.
Arrow left icon
Explore Products
Best Sellers
New Releases
Books
Videos
Audiobooks
Learning Hub
Newsletter Hub
Free Learning
Arrow right icon
timer SALE ENDS IN
0 Days
:
00 Hours
:
00 Minutes
:
00 Seconds
Arrow up icon
GO TO TOP
Mastering Visual Studio 2017

You're reading from   Mastering Visual Studio 2017 Build windows apps using WPF and UWP, accelerate cloud development with Azure, explore NuGet, and more

Arrow left icon
Product type Paperback
Published in Jul 2017
Publisher Packt
ISBN-13 9781787281905
Length 466 pages
Edition 1st Edition
Languages
Tools
Arrow right icon
Author (1):
Arrow left icon
Kunal Chowdhury Kunal Chowdhury
Author Profile Icon Kunal Chowdhury
Kunal Chowdhury
Arrow right icon
View More author details
Toc

Table of Contents (11) Chapters Close

Preface 1. What is New in Visual Studio 2017 IDE? FREE CHAPTER 2. What is New in C# 7.0? 3. Building Applications for Windows Using XAML Tools 4. Building Applications for Windows 10 Using UWP Tools 5. Building Applications with .NET Core 6. Managing NuGet Packages 7. Debugging Applications with Visual Studio 2017 8. Live Unit Testing with Visual Studio 2017 9. Accelerate Cloud Development with Microsoft Azure 10. Working with Source Controls

The new features and enhancements to the Visual Studio IDE

Every new product comes with new features and enhancements to the existing one, to give you more control over what you need. It's the same with Visual Studio 2017 having product version 15. Microsoft has changed many things in this new redesigned IDE and added many things to improve your productivity.

Ranging from the installation point of view to the IDE level, many things have been incorporated. We have already discussed the new installation experience. Now we will discuss the new features/enhancements at this point. Starting from the redesigned start page, we will cover the improved navigation tool, the changes that have been made in the Find All References window, structural guidelines, editor config, the roaming extension manager, lightweight solution loading, connected services, run to click feature, and many more.

Overview to the redesigned start page

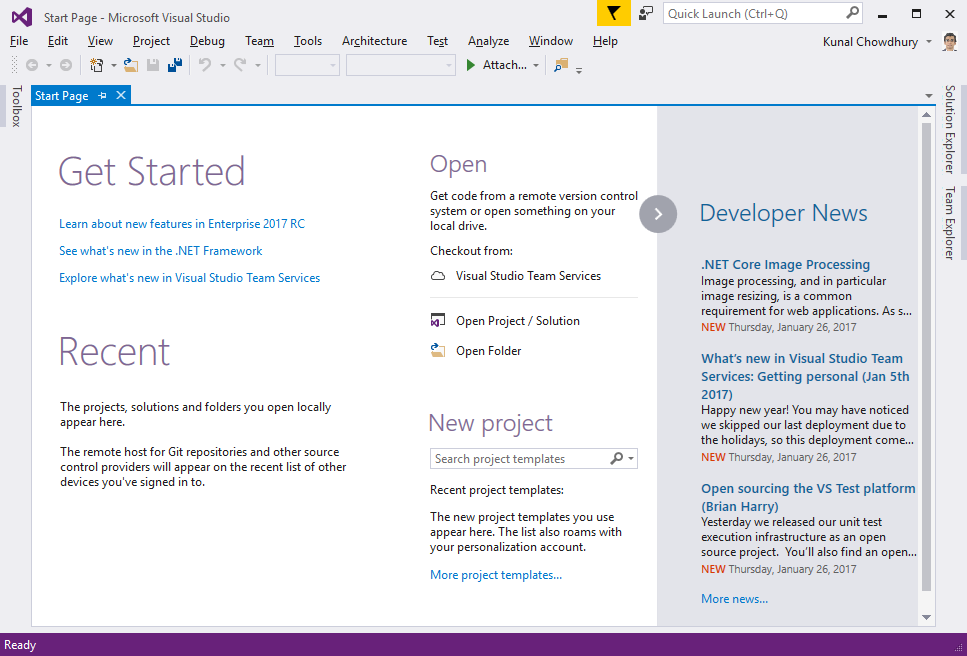
In Visual Studio 2017, Microsoft has brought you a faster installation experience, better performance, and new/enhanced productivity features. One of these productivity features is a Start Page redesigned by the Microsoft team. This will help you start working on your code faster, with easy access to whatever you need.

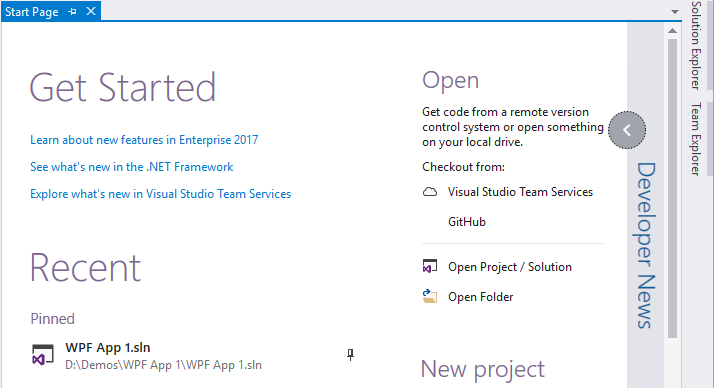
Here is a quick peek of the redesigned Start Page:

The first item here is the Get Started section having a few links to get you started, but this is not always helpful and covers part of your Start Page. To get out of it, hover on the Get Started section to see a close (x) button. Clicking on it will collapse the said section and, thus, will give more space to the Recent / Most Recently Used (MRU) list.

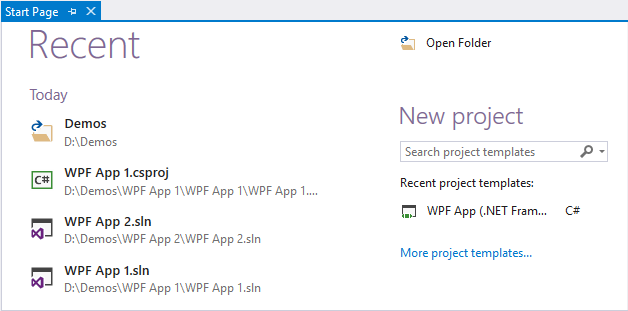
The MRU list in the Start Page will allow you to quickly find what you're looking for. Each MRU item will display an icon denoting it as a project, a solution, a folder, a file path for local resources, or a remote URL for remote items not yet on the local system.

To help you stay more productive in your daily work, the MRU on the Start Page has some additional features:

  • Along with Projects and Solutions, it also lists recently opened folders.
  • It groups the list by date and can accommodate a longer history of files, folders, projects, and solutions.
  • You can pin an MRU item to the top of the list so that you can easily access your most important items.
  • If you are using multiple devices and are already signed into your Visual Studio installation on all the devices, the MRU list will also show you a roaming item.
  • If you cloned a remote repository, Visual Studio will roam the item in any of your devices that have the same associated account, and clicking on any of them will automatically clone it down for you to continue your work. Consider the following screenshot:

The New Project section in the Visual Studio 2017 start screen will allow you to get easy access to the project templates. If you have recently created any projects out of any templates, it will list all those recently used project templates.

You can also search for any project templates and use the one from the list. This is to help you speed up the process of creating new projects using the new IDE by bypassing the steps to find and select the desired template in the New Project dialog. If you sign into Visual Studio, this list will also roam with you across your devices:

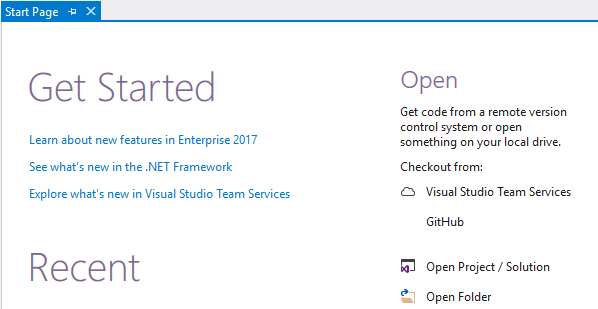
To help you simplify the open project/solution experience, Microsoft placed a panel on the Start Page. From there, you can directly clone your remote repositories, either from on-premise TFS, cloud-hosted TFS, or shared on GitHub. You can also open projects/solution or open the folder from this screen.

The VSTS (Visual Studio Team Services) extension is already in built to Visual Studio 2017; GitHub is a third-party extension, but comes along with it as an optional download. If you are not able to find GitHub on the Start Page, run the installer or install it using the In-Product acquisition:

The Developer News section is the place where you can stay updated with the latest news. Although some developers like to read it every day, not everyone does. Hence, Microsoft now allows you to collapse this section and stay focused on your code-related stuff on the start page. A small badge will be there on the arrow circle to notify you of new posts in the news feed. Consider the following screenshot:

Did you know? Hovering your mouse over the Get Started section provides you with an x button to close the same and gain more space for the Recent/MRU list.

The improved code navigation tool

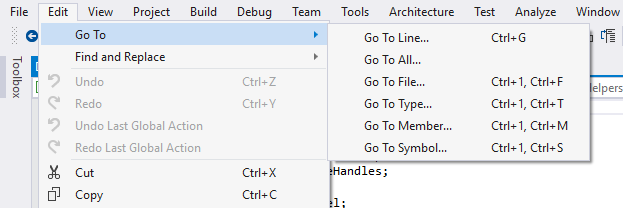
With Visual Studio 2017, Microsoft has improved the code navigation feature to let you quickly find and go to line, files, types, methods, and other elements in your code. It gives you a one-stop way to go to any kind of item that you are looking for, even in a large code base, helping you find the item easily. You can access it from the Visual Studio Edit | Go To menu or by using the keyboard shortcuts listed as follows:

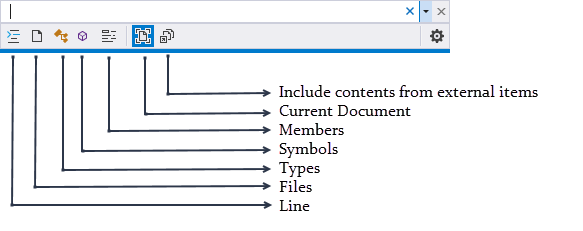
The Go To toolbox that pops up has a few toolbox buttons to easily switch between the navigational types, such as line, files, types, symbols, members, and so on, and a search box:

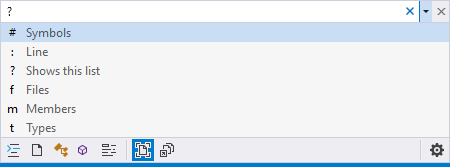
It also offers you easy access to the toolbox buttons with shortcuts. The shortcuts are actually a character that you start the search with. For example, starting a search with t will directly navigate you to Types search. To find out the search key shortcut, enter ? in the search box. It will show help, as shown in the following screenshot:

If you want to navigate to a specific line, enter : <LineNo> (for example, : 25) to see a quick view of the line, and confirming it will directly navigate you to that specific line number. You can also access it using the keyboard shortcut, Ctrl + G.

The Go to line was already there in earlier versions of Visual Studio, but the quick preview of the same before navigating has been added with Visual Studio 2017.

Take a look at the following screenshot to grasp an idea of previewing the line before confirming it:

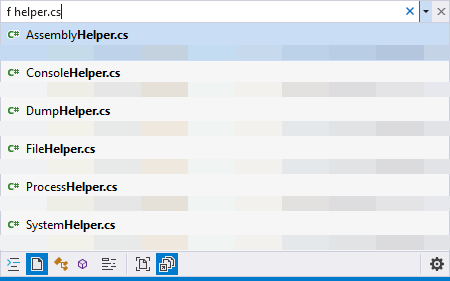
If you start the search with f, followed by the key term, it will search the term in the file name and show you a quick preview of the selected file along with the file path. For example, to list all the C# files having Helper at the end of their names, enter f helper.cs in the search box, as shown in the following screenshot; interestingly, you will see the result along with the file path, which is blurred in this screenshot. Use the up/down arrow keys to select the result for a quick view of the selected file:

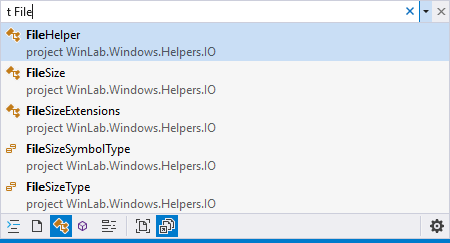
If you want to search for types such as class, interface, enum, and so on, you can start the search with the character t, as shown here:

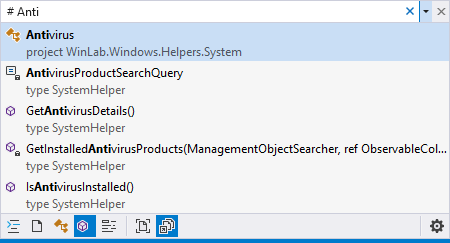
To start a symbol search, begin the search term with the # character and you will find the result having entered term like this:

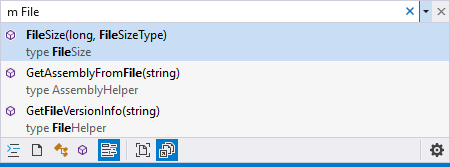
Similarly, to search for a member, begin the search with m and your search key; you will get the result matching the key for any members in the solution, as shown in the following screenshot:

You can also search by clicking on the respective buttons, which will automatically add the contextual search character at the beginning of the search key. However, if you remember the character, it will be very quick for you to access the required resource without using your mouse cursor.

The last two toolbox buttons will help you switch between Current Document and external items. You can quickly switch between them using the keyboard shortcut Ctrl + Alt + C.

Changes to Find All References of an instance

The Find All References command in Visual Studio is not a new thing. It's used to find out all the references of a member or symbol. In earlier versions of Visual Studio, the UI of the result dialog was simple, having only the results in a grouped list. You can find the previous result dialog here:

However, there was always a demand to improve it, as most developers use it regularly to check for references of a member, type, or symbols. Microsoft worked on it in Visual Studio 2017 and have provided a rich UI for developers to improve their daily productivity.

It now has an advanced grouping, filtering, sorting, and searching within the reference result. It now also has a colorization of the term in the result, giving you a clear understanding of the references and directly moving you into the line of code that you are looking for. Here, you can see the new result dialog:

The resultant dialog lists the results in a grid, having column headers to give you clear visibility of the records, which includes the code, file name, line number, and so on for your easy reference. You can use the column headers to sort the result based on your need.

When you hover your mouse over a resultant item in the grid, a tooltip is displayed with the context of the reference in source code. This gives you a quick peek of what you are looking for.

The toolbar of the dialog has many new toolbox items. Let's understand each one of them, as follows:

  1. This list has a few entries with which you can filter the records to solution level, project level, and so on. The list consists of the following entries:
    • Entire Solution
    • Open Documents
    • Current Project
    • Current Document
    • Changed Documents
  1. This is the Copy button that copies the content of the selected record.
  2. These are the two buttons for navigation purposes. This will navigate you to the previous and next location in the list.
  3. This button is used to clear all the filters.
  4. This combination list allows you to change the Group by definition. You can choose any one of the following:
    • Project then Definition
    • Definition only
    • Definition then Project
    • Definition then Path
    • Definition, Project then Path
  1. This is another new toggle button to help you keep the current result on the screen when you trigger another Find All Reference command. When the Keep Results button is turned ON, the next invocation of Find All References will populate the reference results in a new window.
  2. The search box will allow you to search within the result set to give you the perfect result that you are looking for.

Structural guide lines

Visual Studio 2017 also focuses on a new feature called Structural guide lines. The Structural Guide Lines are drawn in the editor so that you can easily visualize the structure of the code that you are currently working on. When you mouse hover on the guideline, a tooltip containing the context of the current code block relative to its ancestor blocks is displayed. Here, in the following screenshot, you can see how the lines are drawn and how the tooltip is displayed with its ancestor blocks when you hover over the guide lines of the using block:

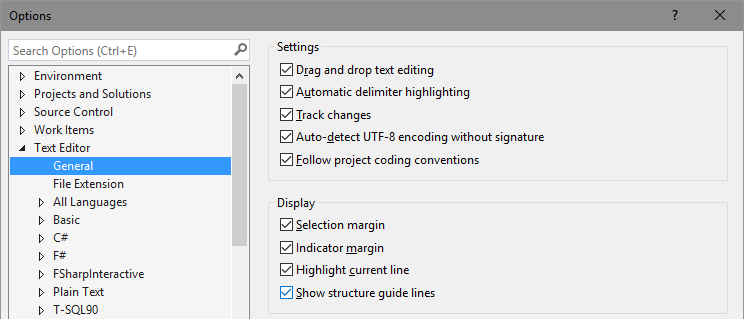
This feature is enabled by default. If you want to disable it, you can navigate to the Visual Studio options dialog at the path: Tools | Options | Text Editor | General, and uncheck the checkbox labelled Show structure guide lines.

To enable it again, follow the same path and check the same box, as shown in the preceding screenshot.

Editor config

Editor config helps developers define and maintain consistent coding styles between different editors and/or IDEs. Microsoft has added support of Editor config in Visual Studio 2017.

The default text editor settings in Visual Studio applies to all projects of a given type. For example, if you change a C# or VB.NET text editor's settings, those settings will apply to all C# projects and VB.NET projects respectively. However, in general, the coding conventions that you use in your personal projects may differ from those used in your team's projects.

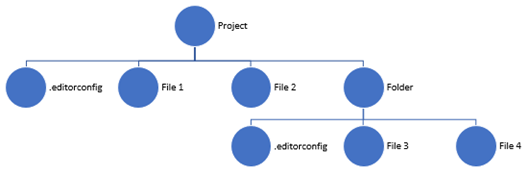
Here comes the Editor Config that enables you to do this on a per project basis and/or per folder level. In this case, the settings are contained in a .editorconfig file added to your code base. As the settings are contained in a file in the code base, they travel along with the code base:

The Editor Config doesn't support a full set of C# formatting rules and, hence, it's not a replacement for format settings in Visual Studio. Currently, it supports the following settings only in Visual Studio 2017:

  • indent_style
  • indent_size
  • tab_width
  • end_of_line
  • charset
  • root
  • trim_trailing_whitespace
  • insert_final_newline
  • Code style conventions

You can create an editor configuration file at the project level or at any folder level. When you add it to the project's root level, its settings are applied across all the files in the project. If you add it to any specific folder level inside the project, the root settings will be overridden and will apply to all applicable files at that level and below.

Did you know? Adding an .editorconfig file to your project or code base will not convert the existing styles to new ones. It will apply the settings to only newly added lines in that code base. To make an entire document adhere to the code formatting rules defined in your editor configuration, you can use the Format Document (Ctrl + K, D) command.

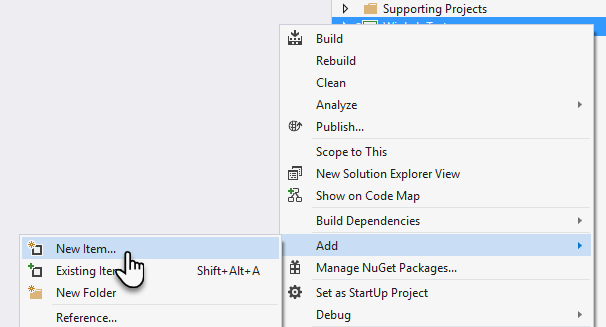
To create an Editor Config (.editorconfig) file, right-click on a project or folder where you want to apply the settings, and then, from the context menu, click on Add | New Item..., as shown in the following screenshot:

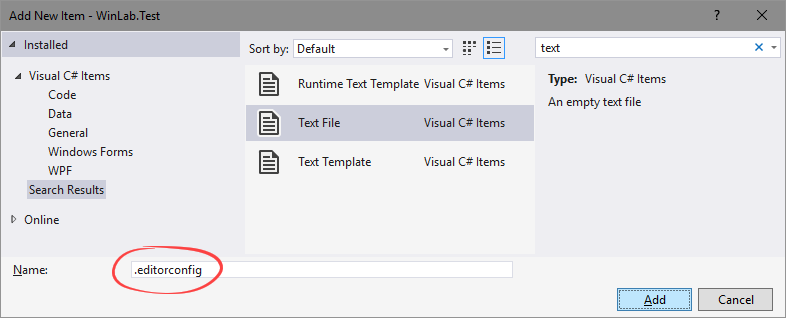
Now, from the Add New Item dialog box, select the Text File template and give it a name, for example, .editorconfig, as shown in the following screenshot, to add the file. Note that the file name only consists of the extension of the file:

The .NET code style settings allow you to enforce the style that you want to use in your code base. Depending on the severity set in the Editor Config, it can show you a suggestion, a compiler warning, or compiler error. This can be written in the following fashion:

options_name = false|true : none|suggestion|warning|error 

The option must specify true (preferable) or false; a colon, :, and a severity of none, suggestion, warning, or error. The default is none.

If you set the severity as none, it will not show anything to the user when this style is not being followed. If you set it as a suggestion, it will show a suggestion (underlying dots on the first two characters) when the style is not being followed. In case of warning or error, it will either show compiler warning or compiler error if the code does not match the style being applied to it.

The Roaming Extension Manager feature

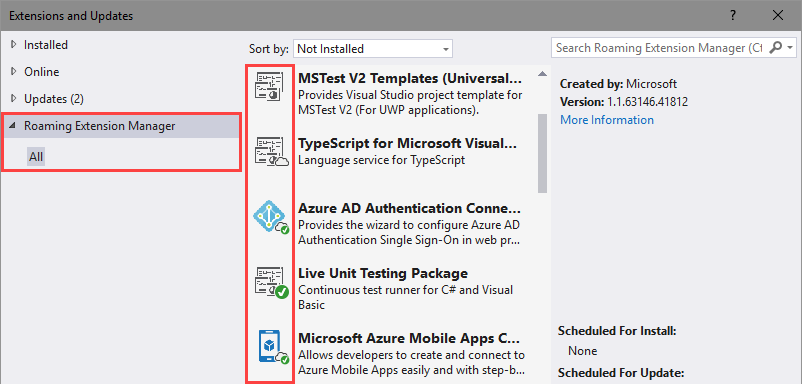
The Roaming Extension Manager is a new feature in Visual Studio 2017 and can be seen under the Extensions and Updates dialog box. This allows you to keep a track of all your favorite extensions. It allows you to sync the installed extensions by creating a synchronized list in the cloud if you have already signed in on all your Visual Studio IDEs across all your development environments.

Navigate to the Tools | Extensions and Updates menu in your Visual Studio instance and expand the entry that says Roaming Extension Manager. Under this, you will find all the extensions roamed with your account. This is shown in the following screenshot:

Here, you will find three kinds of icons:

  • Roamed icon (): If the extension is a part of your roaming list, but not installed on this machine, you will get this roamed icon overlayed on it. Click on the Download button to install the extension.
  • Roamed and installed icon (): This icon will be set as an overlay, when an extension is part of your roaming list and is installed on this system too.
  • Installed icon (): When an extension is not a part of your roaming list, but present on this machine, it will get this installed icon overlay.

If you want to add any extensions to the roaming list to roam along with your account, select the specific extension and click on the Start Roaming button. When the extension is roaming, it will auto-install on the other system, where you sign in to Visual Studio with the same personalized account:

If you do not want to roam an extension for any reason, you can remove it from the roaming list by clicking on the Stop Roaming button of that extension, which is shown in the following screenshot:

If you have any favorite extensions that you use regularly on all your devices, you will love to sync them with your account. This way, you don't have to manually search and install them on the new system where you will write your code.

Did you know? If you download an extension when you are already signed in to Visual Studio 2017, it will be added to your roaming list, giving you easy access to it from any of your development environments.

Open folders in a convenient way

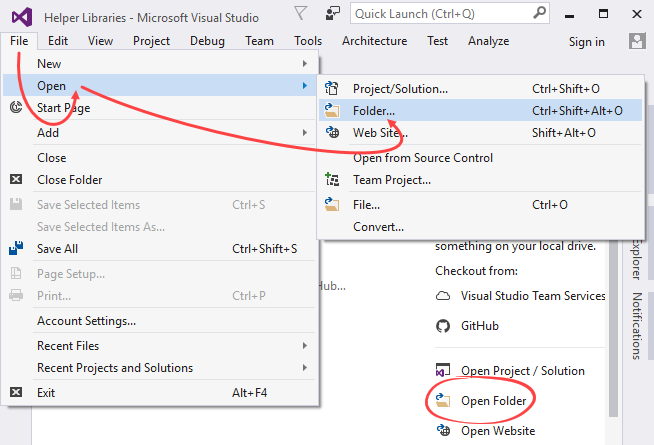
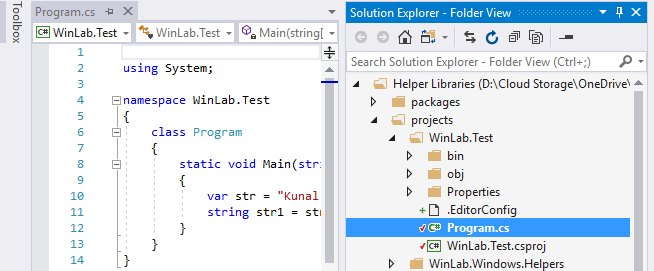
In Visual Studio 2017, Microsoft has provided a convenient way to work with the code base. You can now directly open a folder instead of opening the solution/project explicitly. When you open a folder, you can easily navigate to all files by structural folders using the Solution Explorer. Not only this, but you can also build your projects from the Solution Explorer; right-click on context menu.

In order to open a folder, you can click on File | Open | Folder... from the Visual Studio menu or the Open Folder link present on the Start Page. Alternatively, you can press the keyboard shortcut: Ctrl + Shift + Alt + O:

The folder view also supports the following:

  • Searching across the code in your folder with the Go To (Ctrl + ,) command.
  • Scoping the Solution Explorer folder view to subfolders. To scope your current context to a specific project/folder, right click on it and then click on Scope To This from the context menu.
  • Opening folders in Explorer or the Command Prompt from the Solution Explorer itself.
  • Easily toggle between solutions with the Solution selection dropdown.
  • Configuring the debug and launch settings with launch.json. Right-click on a debuggable file and select Debug and Launch Settings.
  • Configuring tasks and customizing the build with tasks.json. Right-click on any file and select Configure Task Settings.
  • Launch.vs.json and tasks.vs.json have IntelliSense in the JSON editor.
  • Integration with supported source control repositories. This will provide you the current status of the file. As shown in the following screenshot, a + or a tick mark provides you the status of the local file in comparison with the version available in source control repository:

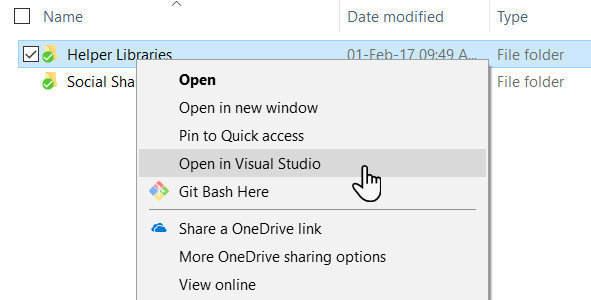
You can also open a folder from the Windows Explorer window by right-clicking on any folder and then clicking the Open in Visual Studio context menu item, as shown in the following screenshot:

Lightweight solution loading

Lightweight solution loading is yet another feature of Visual Studio 2017 that enables you to load large solutions faster, reducing the load time and memory usages, as it loads only the files that are needed (per need basis). It is best suited to large solutions that contain C# or a mix of C# and C++ projects. If Visual Studio decides that you are working with large solutions, it will prompt you to enable this feature.

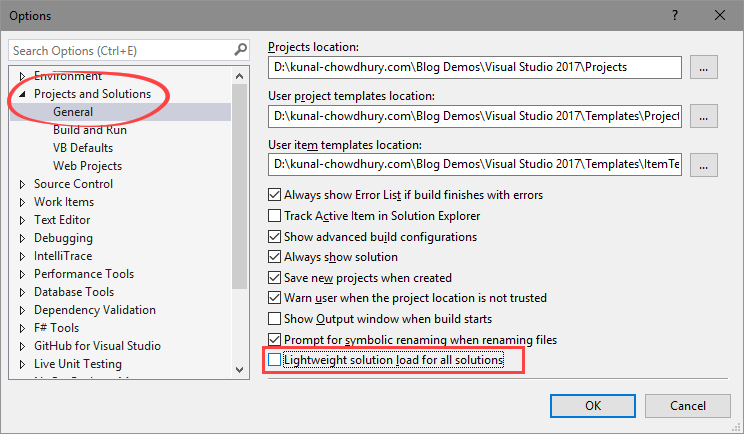
This feature is not enabled by default. To enable it, open Visual Studio Options from Tools | Options and navigate to Projects and Solutions | General. On the right-side panel, you will find a setting labelled Lightweight solution load for all solutions. Check it to enable the feature. Uncheck it if you decide to go back to the previous settings.

Alternatively, you can search for Lightweight Solution load in the Quick Launch search box to directly navigate to it:

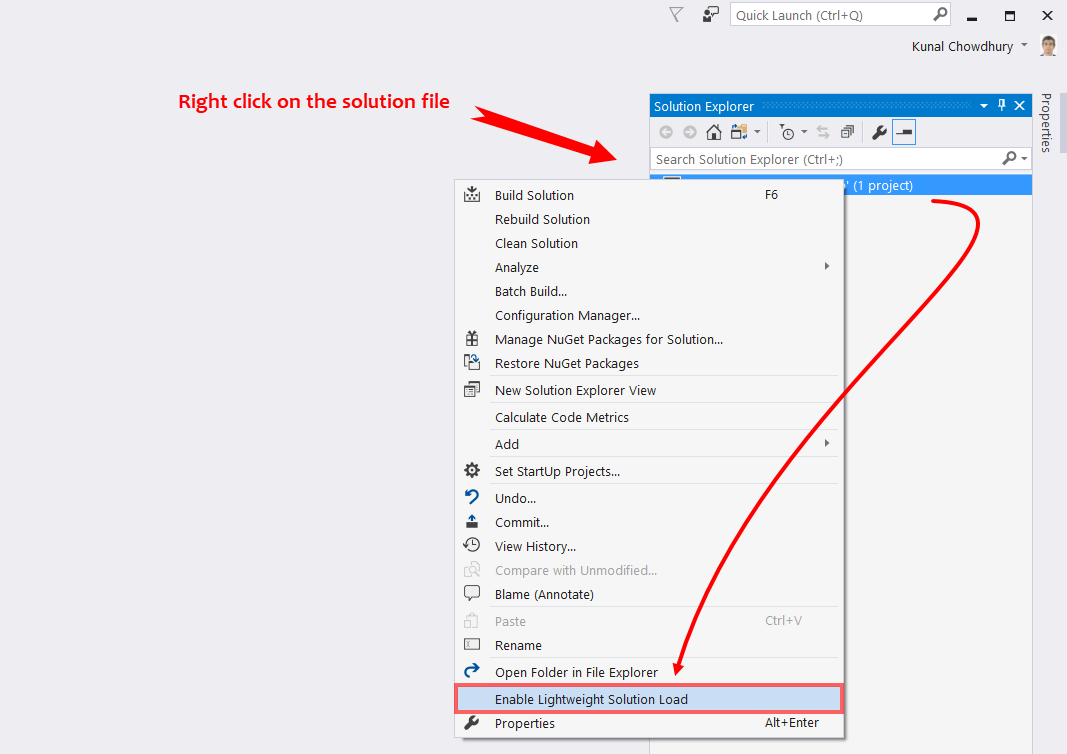
Once you enable the feature, it will apply the lightweight solution loading to all solutions that you open using Visual Studio 2017. If you don't want this but would like to open a solution only, you can enable it for that specific solution by right-clicking on the solution file in the Solution Explorer. There, you will find a context menu entry that says Enable Lightweight Solution Load. This is shown in the following screenshot:

Connected Services

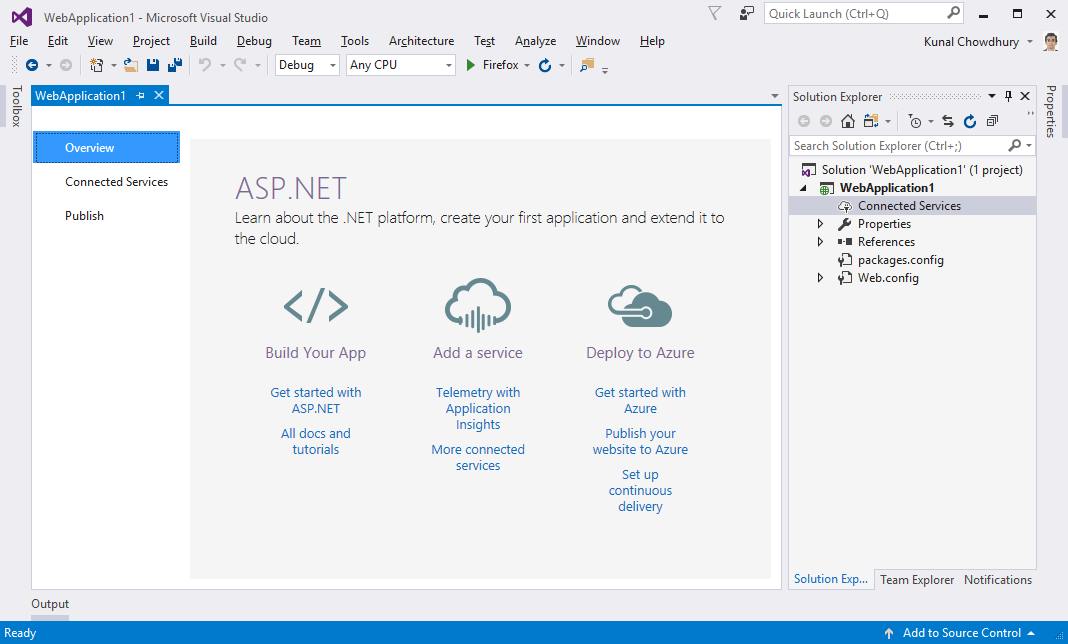
Microsoft added a new Getting Started experience for freshly created projects in Visual Studio 2017. It replaced existing Getting Started pages with an Overview tab in the new App Configuration Designer and focused the page on the actions that will get you started quickly to build your app, add an application insight/other connected services, publish your app to Azure, and set up continuous delivery:

In Visual Studio 2015, we saw a section called Service Capabilities. In Visual Studio 2017, they have changed it to Connected Service to modernize the Add Connected Service and Add Service Reference features.

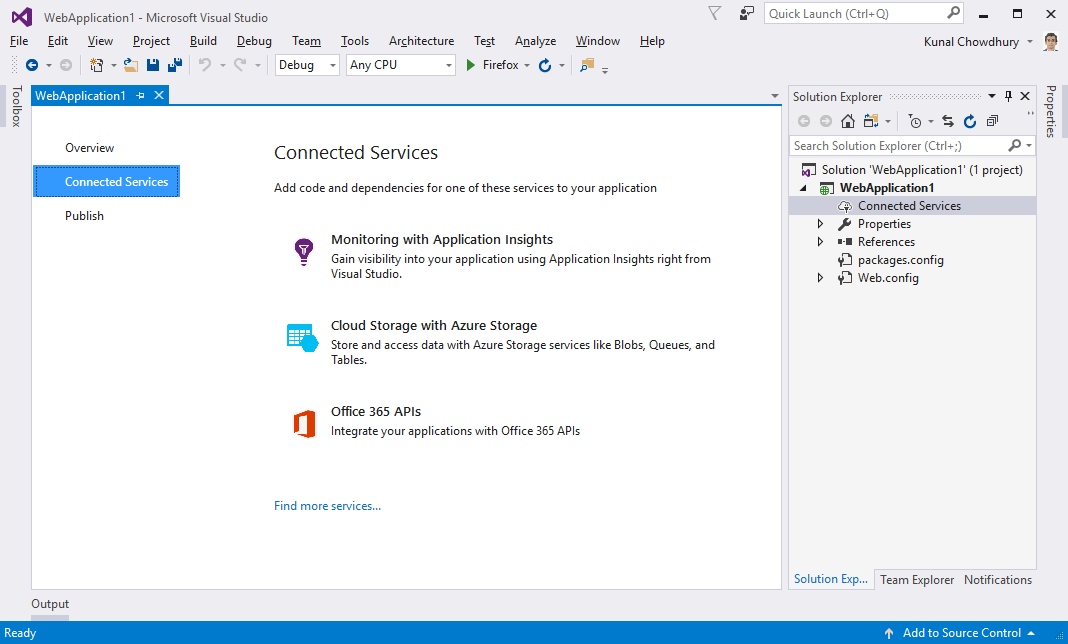
This will allow you to connect your app to services. A new node called Connected Services is available in the Solution Explorer for web and mobile applications. Double-clicking on this node will open a new full-page tab in Visual Studio where you can configure popular Microsoft services available for you to connect to.

Using Monitoring with Application Insights, you can gain insights through telemetry, analytics, and smart detection in the following ways:

  • Detect and diagnose exceptions and application performance issues
  • Monitor the website insights hosted on Azure, containers, on-premises, and on other cloud providers
  • Integrate with your DevOps pipeline using Visual Studio, VSTS, GitHub, and Webhooks

Here is the screenshot of the Connected Services screen present inside Visual Studio 2017:

The Cloud Storage with Azure Storage feature will allow you to store and access data with Azure Storage services, such as Blobs, Queues, and Tables. If you have an Azure subscription, you can connect to it and start using it on your web or mobile apps. You can also connect to the Azure App Service to add authentication and deliver push notifications for mobile apps.

The other popular service, Office 365 APIs, will allow you to integrate your applications with Office 365 Services. A wizard is there to help you easily configure your project to connect with services such as mail, calendar, contacts, files, and more. You can also create an application in the Azure Active Directory associated with your Office 365 domain. To get started, you should have a valid Office 365 subscription available.

There is a Find more services link at the bottom of the page, which will open the Visual Studio Marketplace under the Extensions and Updates option, where you will be able to connect to more services.

Acquiring tools and features by using In-Product Acquisition

Visual Studio 2017 makes it easier to acquire any missing components using In-Product Acquisition. Using this, you don't have to leave the IDE to start the installer. Using the Quick Launch search bar, you can kick off the installer to start an in-product acquisition of any workload or individual component. Consider the following screenshot:

The preceding image shows us how to use Visual Studio to acquire a Universal Windows Platform development workflow and other related components. This will directly launch the installer and proceed towards the installation of said workflow.

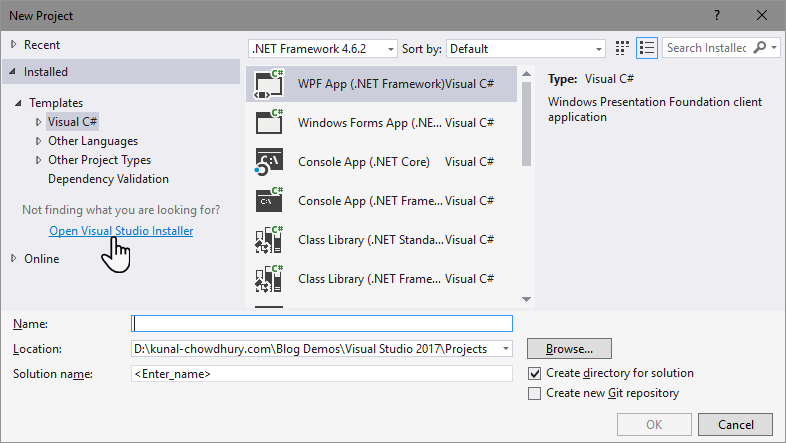
If you cannot find the templates that you are looking for, the Visual Studio 2017 installer can also be opened from the New Project dialog box, as shown in the following screenshot:

The Run to Click feature

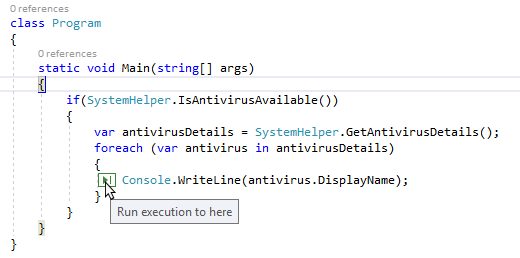
Debugging now becomes easier with Visual Studio 2017. You can simply click on an icon next to a line of code to run to that line while debugging. When you have stopped at a breakpoint, just click on the green Run to Click icon that subtly appears next to the line of code that your mouse is hovered over. This will reduce the burden of adding temporary breakpoints and several steps that need to be performed to break the debugger to a specific line on the fly:

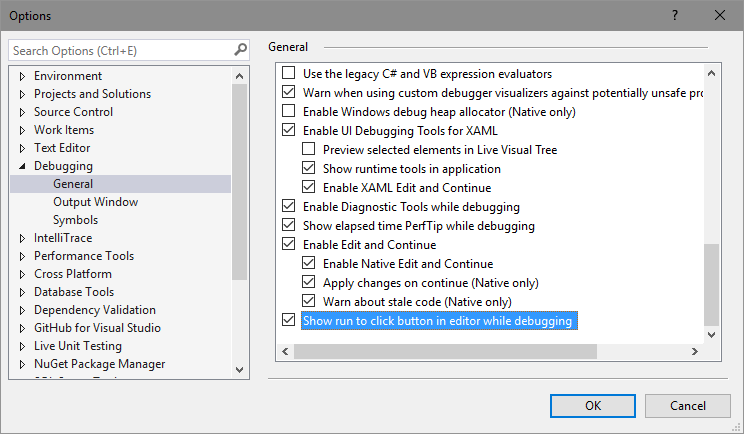
This feature is enabled by default. To disable it, click on the menu item Tools | Options and then navigate to Debugging | General. Alternatively, you can directly navigate there by clicking on the menu item Debug | Options. Scroll to the end of the right-side panel and find an option labelled Show run to click button in editor while debugging. Uncheck it to disable the feature.

If you want to re-enable it later, follow the same steps and check the aforementioned option. Consider the following screenshot:

Improved Attach to Process with process filtering

In the earlier versions of Visual Studio, it was quite difficult to search for a particular process in the Available Processes list of the Attach to Process dialog box. To overcome this, Microsoft has added a search box in the top-right corner of the list. It will help you filter the list and find out the exact process that you are looking for:

To help you further in this long process list, history entry has been added to the search box. When you are in this window at a later point of time, you can click on the arrowhead to select the last search item from the list.

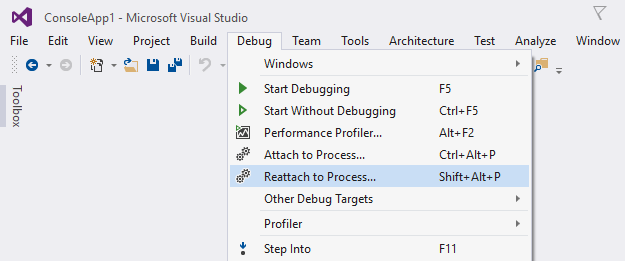
A new entry labelled Reattach to Process... has been added to the Debug menu of Visual Studio 2017 to help you reattach to the process that you used last. Alternatively, you can press the keyboard shortcut, which is Shift + Alt + P, to directly attach the debugger to the last processes from the previous debugging session. This is shown in the following screenshot:

The debugger will first try to reattach to the process by matching the previous process ID, and then by matching to the previous process name. If no matches are found, or if there are multiple processes with the same name, the Attach to Process dialog will open to allow you to select the desired process from the list.

The new exception helper

Handling an exception is the most crucial part for a developer and it becomes frustrating when you are unable to define the cause of the same. Previous versions of Visual Studio do not provide more details about the exception other than a generic contextual UI to the developer in debug mode.

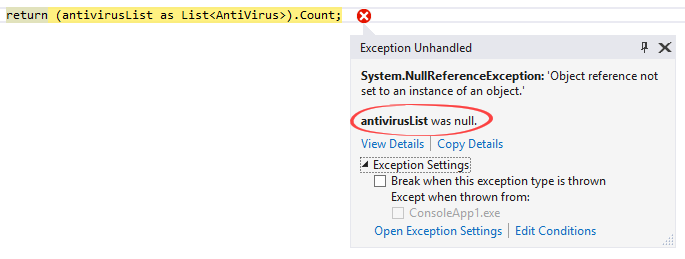
Microsoft worked on a redesigned UI for the exception helper to give you more details of the exception in a compact non-modal dialog with quick access to the inner exception. When there is a NullReferenceException, the new UI shows you what was null. Take a look at the following screenshot that shows antivirusList was null, which caused the issue:

Add conditions to Exception Settings

Visual Studio 2017 allows you to add conditions when you configure the debugger to break on thrown exceptions from a specific module. Thus, the breakpoint will hit only when the specified condition is met. You can use the asterisk/wildcards to broaden the conditions, as shown in the following screenshot:

Updates to Diagnostic Tools

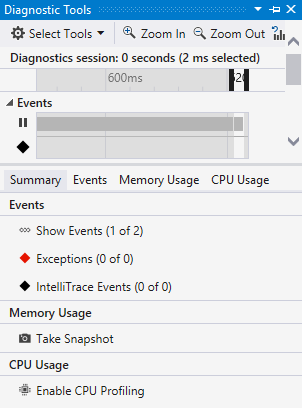
When you start your debugging session inside Visual Studio, the Diagnostic Tools window becomes visible, having many details on the screen. With Visual Studio 2017, you can now view the number of Application Insights and UI Analysis events (UWP apps only) that occurred in your application, along with the number of Exceptions and IntelliTrace events. You can also take a memory snapshot of your heap and enable or disable the CPU profiling:

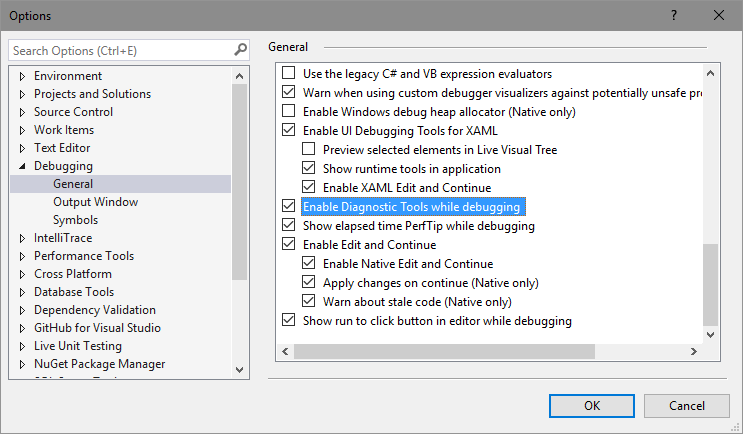
If you don't want to load Diagnostic Tools when the debugger session starts, you can disable it by unchecking the Enable Diagnostic Tools while debugging checkbox under the debugging options. Consider the following screenshot:

You have been reading a chapter from
Mastering Visual Studio 2017
Published in: Jul 2017
Publisher: Packt
ISBN-13: 9781787281905
Register for a free Packt account to unlock a world of extra content!
A free Packt account unlocks extra newsletters, articles, discounted offers, and much more. Start advancing your knowledge today.
Unlock this book and the full library FREE for 7 days
Get unlimited access to 7000+ expert-authored eBooks and videos courses covering every tech area you can think of
Renews at $19.99/month. Cancel anytime
Banner background image