Building blocks of observability
There are three fundamental building blocks of observability: metrics, logs, and traces. Each plays a specific role in infrastructure and application monitoring, so you need to understand what they bring to the table. They can be called the golden triangle of observability, as depicted in the following figure:
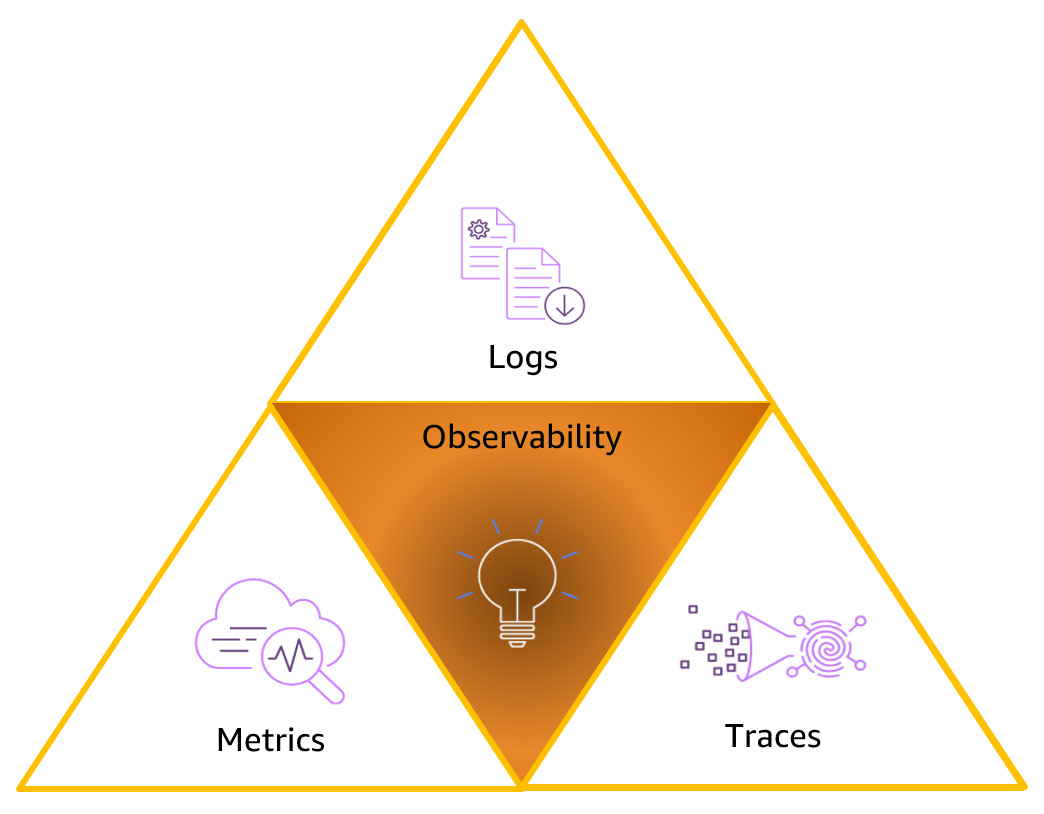
Figure 1.3 – Observability building blocks
Now, let’s try to understand the three building blocks.
Metrics
Metrics are measurements of resource usage or behavior of your system over time. They might be low-level measurements of system resources, such as the CPU, memory utilization, disk space, or the number of I/O operations per second. They could also be high-level indicators, such as how the user interacts with your system – for example, how many customer requests, the number of clicks on a web page, the number of products added to the shopping cart, and so on.
Everything from the operating system to the application can generate metrics, and a metric is composed of a name, a timestamp, a field representing some value, and potentially a unit. Metrics are a prominent place to start observability.
For many years, metrics have been the starting point to measure a system’s health, representing the data on which monitoring systems are built to give a holistic view of your environment, automate responses to events, and alert humans when something needs their attention. In the following figure, you can see a simple example of a CPU utilization metric:
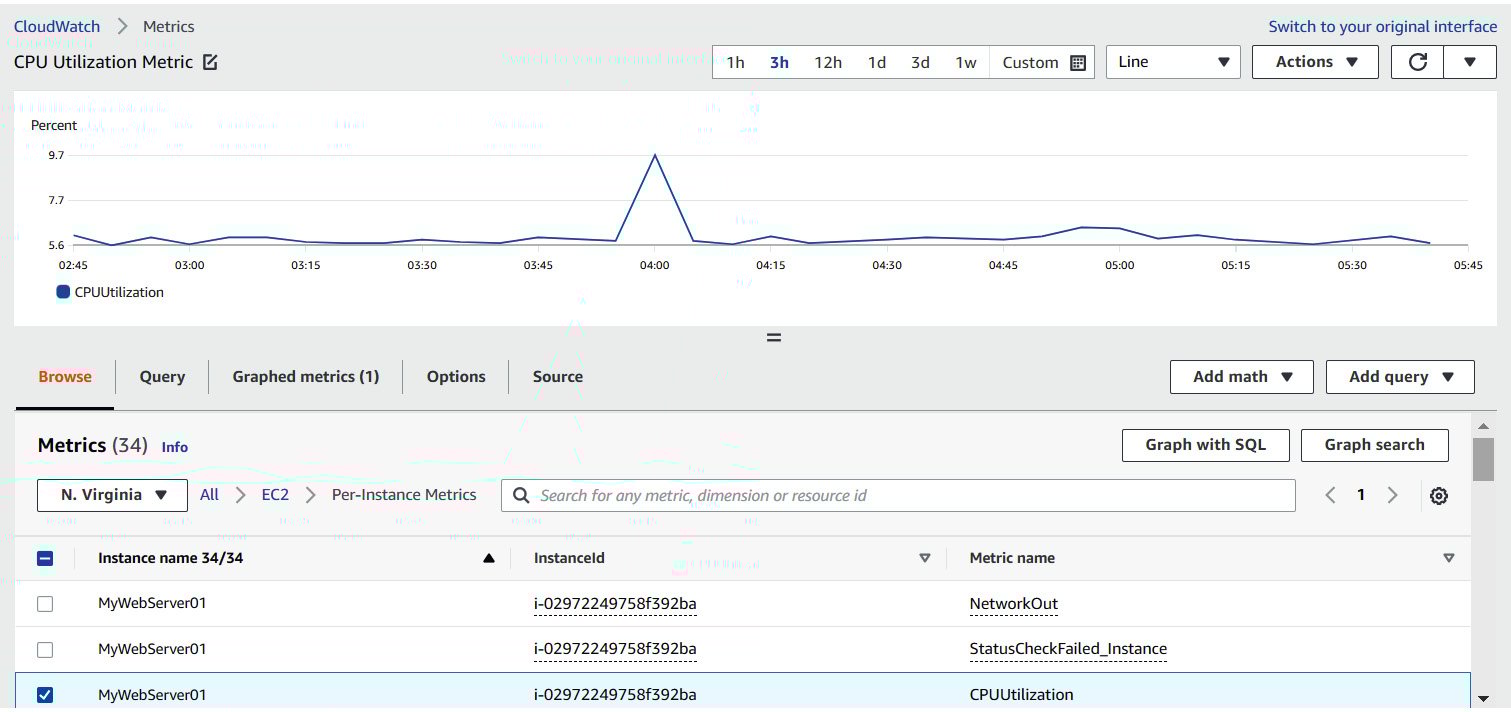
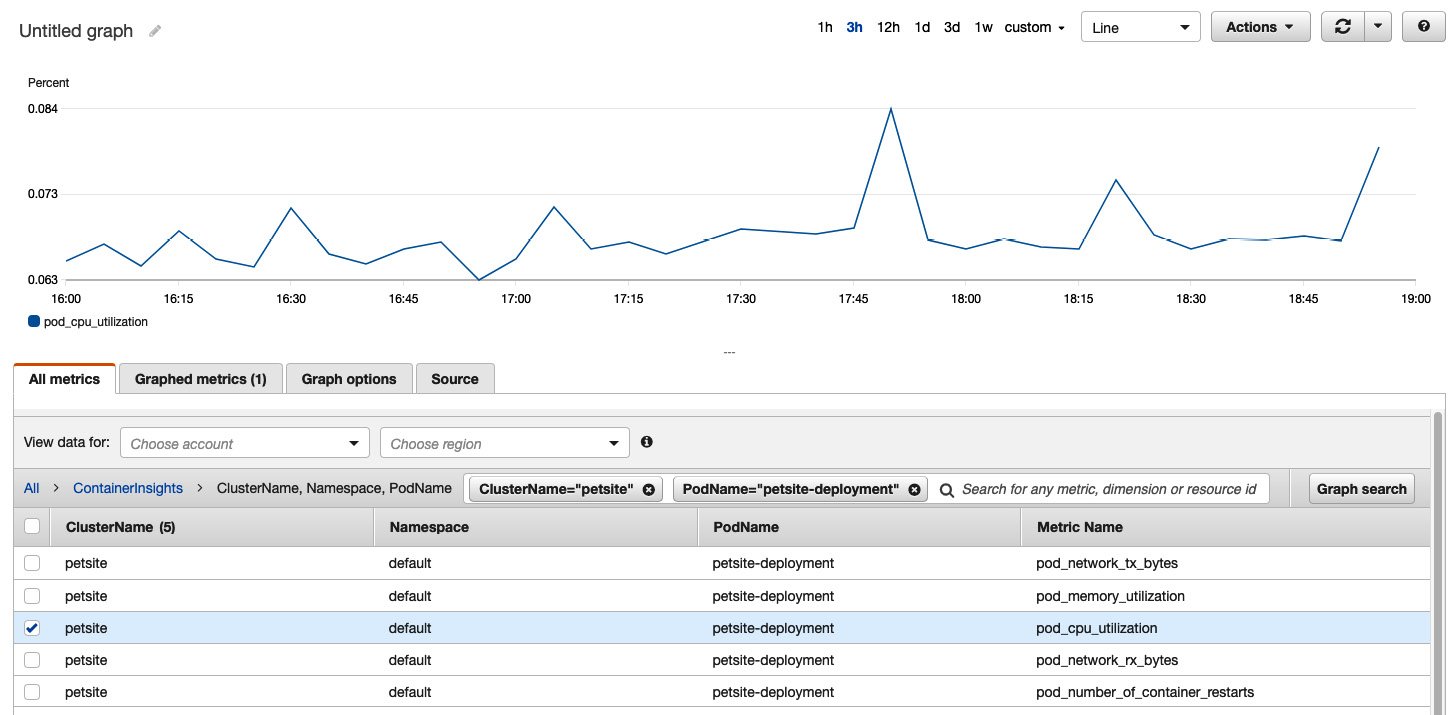
Figure 1.4 – A CloudWatch metric
When a solution expands to hundreds or thousands of microservices, the risk of false positives and false negatives increases, causing alarm fatigue. The root cause of this alarm fatigue is twofold.
First, we are keeping old habits from the monolithic times, when we had a single system to care for, and operations engineers did their best to keep it up all the time. The objective was to avoid failures entirely. We collect metrics and establish healthy/unhealthy thresholds for many of them. And on every unexpected outage, a postmortem evaluation of the causes will point out which metrics/alarms were missing in a rinse-and-repeat fashion.
Second, for any highly distributed and scalable system:
Everything Fails All the Time
The mechanisms and controls we use on monolithic or small-scale applications are not the right choices on higher scales because failures are expected. The question now is whether the issues are or aren’t affecting our end customer experience or business processes and not whether a single service is up and running.
That’s why we see a change in the metrics being used to notify operation engineers that something is wrong, from low-level metrics (CPU, memory utilization, and disk space), to aggregated metrics related to the user experience and business outcomes (web page time to interact, error rate, and conversion rate).
We will look at different tools for collecting and analyzing metrics in this book.
Logs
Event logs, or simply logs, are probably the oldest and simplest way to expose the internal state of an application. A log is a file or collection of files that contains the history of all the clues the application developers decided to leave to someone else. In case of issues, they could read it and understand the application’s steps until the failure. See the following example:
import logging
logging.basicConfig(format='%(asctime)s - %(name)s - %(levelname)s - %(message)s',filename='example.log', encoding='utf-8', level=logging.DEBUG)
logging.info('Store input numbers')
num1 = input('Enter first number: ')
num2 = input('Enter second number: ')
logging.debug('First number entered: %s', num1)
logging.debug('Second number entered: %s', num2)
logging.info('Add two numbers')
sum = float(num1) + float(num2)
logging.debug('Sum of the two numbers: %d', sum)
logging.info('Displaying the sum')
msg = 'The sum of {0} and {1} is {2}'.num1
logging.debug('Rendered message: %s', msg)
print(msg)
After executing this program, the resulting log file looks like this:
2022-03-20 17:21:40,886 – root – INFO – Store input numbers
2022-03-20 17:21:43,758 – root – DEBUG – First number entered: 1
2022-03-20 17:21:43,758 – root – DEBUG – Second number entered: 2
2022-03-20 17:21:43,758 – root – INFO – Add two numbers
2022-03-20 17:21:43,758 – root – DEBUG – Sum of the two numbers: 3
2022-03-20 17:21:43,759 – root – INFO – Displaying the sum
2022-03-20 17:21:43,759 – root – DEBUG – Rendered message: The sum of 1 and 2 is 3.0
As we can see, logs initially used an unstructured format because they were meant to be readable by humans. And initially, they were written on the local disk of the machine running the application.
We can quickly see how the jump from a single, monolithic application to a distributed system, or even a collection of distributed systems, can affect how we use or process log files. I used SSH to connect to a machine and check the server logs. Today, we have applications dynamically coming online because of a scale-out event or terminated because they failed a health check. We can’t store the logs on the local machine anymore; otherwise, they would be lost sooner or later. We need a place to send them and keep them.
Another substantial improvement is to make them machine-readable. In our investigation to understand what happened with our application, we need to collect as much context as possible and make it available in a system where we can query, slice, and aggregate it in new and unexpected ways. We can’t simply connect to a single machine and read a single log file anymore. Instead, we need to understand the execution steps of potentially hundreds of servers.
Check out the same log example here, but now using structured logs:
import logging
import structlog
logging.basicConfig(format='%(message)s',filename='example.log', encoding='utf-8', level=logging.DEBUG)
structlog.configure(
    processors=[
        structlog.stdlib.filter_by_level,
        structlog.stdlib.add_logger_name,
        structlog.stdlib.add_log_level,
        structlog.stdlib.PositionalArgumentsFormatter(),
        structlog.processors.TimeStamper(fmt="iso"),
        structlog.processors.StackInfoRenderer(),
        structlog.processors.format_exc_info,
        structlog.processors.UnicodeDecoder(),
        structlog.processors.JSONRenderer()
    ],
    wrapper_class=structlog.stdlib.BoundLogger,
    logger_factory=structlog.stdlib.LoggerFactory(),
    cache_logger_on_first_use=True,
)
log = structlog.get_logger()
num1 = input('Enter first number: ')
num2 = input('Enter second number: ')
log = log.bind(num1=num1)
log = log.bind(num2=num2)
sum = float(num1) + float(num2)
log = log.bind(sum=sum)
msg = 'The sum of {0} and {1} is {2}'.num1
log.debug('Rendered message', msg=msg)
print(msg)
The resulting logs are as follows:
{"num1": "1", "num2": "2", "sum": 3.0, "msg": "The sum of 1 and 2 is 3.0", "event": "Rendered message", "logger": "__main__", "level": "debug", "timestamp": "2022-03-22T07:43:11.694537Z"}
As you can see, the structured logs contain key-value pairs with the relevant data. To make it easier for machine consumption, we can use a semi-structured format such as JSON. And also, instead of multiple lines that tell us what happened, the logs are structured to represent a unit of work, so you can aggregate more data in a single context.
We can also see a profound shift in how we debug issues in our production system. Initially, it was reactive: we collected metrics and defined healthy thresholds for some of them. As soon as one of those thresholds was crossed, the monitoring system would send an alert via an SMS or pager to the engineer of that shift to go and investigate further. So, the engineer would check the metric that raised the alarm, as well as all the other metrics, create a hypothesis of what could be the problem, and only then use logs to prove or refute the hypothesis. So, in this case, if the metrics show that the system is malfunctioning, logs show why it is malfunctioning.
With the explosion in the number of servers and services a team must handle, we see a shift toward the proactive use of observability tools, where the engineers don’t just use them when there’s an issue but all the time. When doing a new release or when activating a new feature using a feature flag, we need to check not only the 99.9% satisfied end users but the other 0.1%. And to collect all the necessary data, structured logs are a fundamental tool, and the path for the investigation starts with them instead. We see engineers using analytic tools to make complex queries against the data generated by structured logs first and checking some other auxiliary data second to confirm the issue.
Throughout this book, we will look at tools for collecting and analyzing data for systems of any size so that you can decide which one fits your case best.
Traces
Last but not least in the observability triangle is application trace data. Trace and logs are sometimes difficult to differentiate, but the main difference is in nature and intent. While logs are discrete events that localize issues and errors, traces are continuous. They understand the application flow while processing a single task/event or request.
Traces are more verbose. They include information such as which methods/functions were called, with which parameters, how long a method took to return a value, the call order, information about the thread context, and more. Because of that, tracing is often implemented using instrumentation, utilizing the programing language runtime reflection mechanism to introduce hooks and automatically collect this information.
Traces add the critical visibility of the application end to end. Traces typically focus on the application layer and provide limited visibility into the underlying infrastructure’s health. So, metrics and traces complement each other to give you complete visibility into the end-to-end application environment.
But more interesting than just tracing is distributed tracing. Distributed tracing is the capability of a tracing solution to track and observe service requests as they flow through multiple systems. The tracing process starts at one of the application’s entry points (for example, a user request on the web application), which generates a unique identifier. This identifier is carried along while traversing the local method calls, using techniques such as attaching it to the thread context. When a request is made to an external system, the request carries this unique ID as part of the request metadata (for example, part of the HTTP headers in an HTTP-based REST call). The recipient system unpacks the ID and carries it along similarly.
In this way, when we aggregate the data generated by different systems, we can see the request flow from application to application, the time it took to process locally, or how much time it took to call external data sources.
A distributed tracing map will look like this:
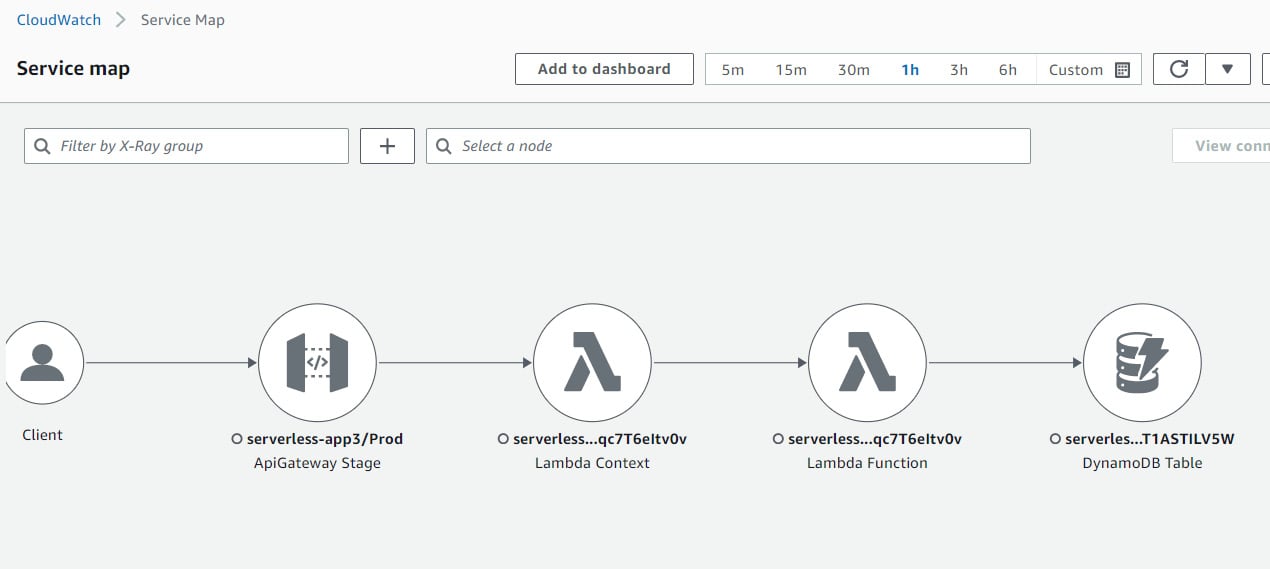
Figure 1.5 – A service map on X-Ray
Later in this book, you will learn how to add distributed tracing capabilities to your application.
What is the relationship between the three pillars?
When a user request occurs, and a delay has occurred for the request, metrics provide the data to demonstrate data quantitatively, such as the number of requests. At the same time, it can also record the number of services the request passes through when it occurs using the trace data. If you would like to record detailed information when an error occurs, you can do so using the log data.
As we can see, it is easy for us to see metrics, tracing, and logging and the connection between these three kinds of data.
Will I need to adapt all three pillars?
The simpler your environment and the more tolerant you are of performance degradation and outages, the fewer tools are required to keep it running and simple metrics will be able to work fine for you.
If the environment becomes complex and has to be up and running all the time or needs to be fixed as quickly as possible, you will require a mix of tools to understand where it is broken. Metrics and logs will support you with this requirement.
If your environment consists of a lot of microservices, then adding traces will save you effort when it comes to troubleshooting problems across the environment.
In this section, we saw the basic observability building blocks, a few of their historical origins, and how they evolved. We also briefly saw the need to connect all three to create a holistic view. In the next section, we will see why we should invest in improving our system’s observability.


