Dashboards
Amazon CloudWatch enables users to create custom dashboards which can include CloudWatch metrics or text data. We can create a dashboard which includes all the AWS resource metrics and images, which gives us an overall picture of application operations. We can monitor all the resources in one place so that we don't need to search different metric data. Dashboards allow us to show data that is available in different regions, so if your application resides in multiple AWS regions, we can get all the regions' resource data and show it in one place.
Let's build a dashboard that includes RDS CPUUtilization metrics.
AWS Management Console
The following are the steps to create a dashboard using the AWS Management Console:
- Go to the Amazon CloudWatch Console and click
Dashboardsin the navigation pane on the left, or you can go directly to https://console.aws.amazon.com/cloudwatch/home#dashboards. - Click
Create dashboard:
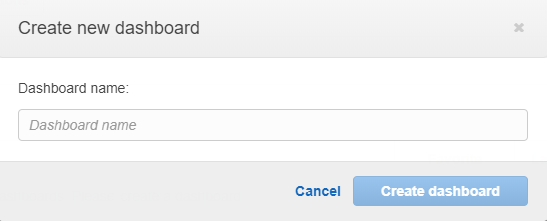
Figure 9.11: Creating a dashboard
Type in AWS-Bootcamp as the dashboard...


