Search icon CANCEL
Subscription
0
Cart icon
Your Cart (0 item)
Close icon
You have no products in your basket yet
Save more on your purchases! discount-offer-chevron-icon
Savings automatically calculated. No voucher code required.
Arrow left icon
Explore Products
Best Sellers
New Releases
Books
Videos
Audiobooks
Learning Hub
Free Learning
Arrow right icon
Arrow up icon
GO TO TOP
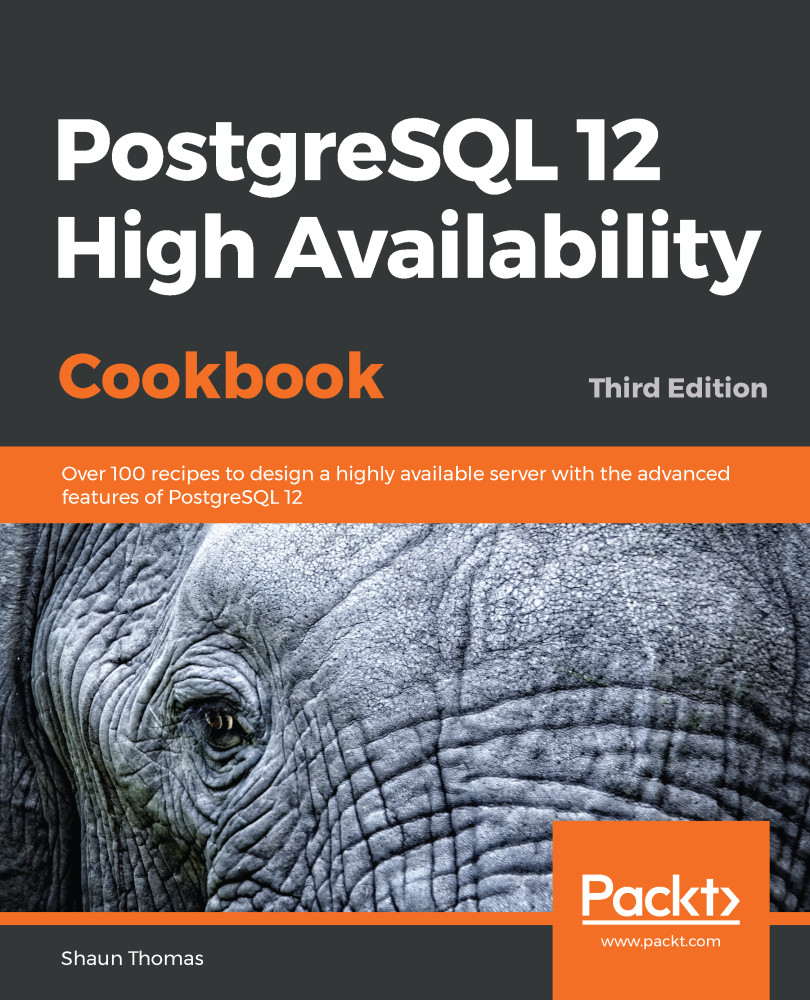
PostgreSQL 12 High Availability Cookbook

You're reading from   PostgreSQL 12 High Availability Cookbook Over 100 recipes to design a highly available server with the advanced features of PostgreSQL 12

Arrow left icon
Product type Paperback
Published in Feb 2020
Publisher Packt
ISBN-13 9781838984854
Length 734 pages
Edition 3rd Edition
Languages
Concepts
Arrow right icon
Author (1):
Arrow left icon
Shaun Thomas Shaun Thomas
Author Profile Icon Shaun Thomas
Shaun Thomas
Arrow right icon
View More author details
Toc

Table of Contents (17) Chapters Close

Preface 1. Architectural Considerations 2. Hardware Planning FREE CHAPTER 3. Minimizing Downtime 4. Proxy and Pooling Resources 5. Troubleshooting 6. Monitoring 7. PostgreSQL Replication 8. Backup Management 9. High Availability with repmgr 10. High Availability with Patroni 11. Low-Level Server Mirroring 12. High Availability via Pacemaker 13. High Availability with Multi-Master Replication 14. Data Distribution 15. Zero-downtime Upgrades 16. Other Books You May Enjoy

Evaluating the current disk performance with iostat

Due to the disparity in speed between storage and RAM, one of the first signs of distress that a DBA will observe is directly related to disk utilization. A badly written query, an unexpected batch-loading process, a forced checkpoint, overwhelmed write caches—the array of things that can ruin disk performance is vast.

The first step in tracking down the culprit(s) is to visualize the activity. The iostat utility is fairly coarse in that it does not operate at the process level. However, it does output storage activity by device and includes columns such as reads or writes per second, the size of the request queue, and how busy it is compared to its maximum throughput.

This allows us to see the devices that are actually slow, busy, or overworked. Furthermore, we can combine this information with other methods of analysis...

lock icon The rest of the chapter is locked
Register for a free Packt account to unlock a world of extra content!
A free Packt account unlocks extra newsletters, articles, discounted offers, and much more. Start advancing your knowledge today.
Unlock this book and the full library FREE for 7 days
Get unlimited access to 7000+ expert-authored eBooks and videos courses covering every tech area you can think of
Renews at $19.99/month. Cancel anytime
Banner background image