Profiling best practices
Profiling is a repetitive task. You'll do it several times inside the same project in order to get the best results, and you'll do it again on the next project. Just like with any other repetitive task in software development, there is a set of best practices you can follow to ensure that you get the most out of the process. Let's look at some of them:
Build a regression-test suite
Before starting any kind of optimization process, you need to make sure that the changes you make to the code will not affect its functioning in a bad way. The best way to do this, especially when it's a big code base, is to create a test suite. Make sure that your code coverage is high enough to provide the confidence you need to make the changes. A test suite with 60 percent code coverage can lead to very bad results.
A regression-test suite will allow you to make as many optimization tries as you need to without fear of breaking the code.
Mind your code
Functional code tends to be easier to refactor, mainly because the functions structured that way tend to avoid side effects. This reduces any risk of affecting unwanted parts of your system. If your functions avoid a local mutable state, that's another winning point for you. This is because the code should be pretty straightforward for you to understand and change. Functions that don't follow the previously mentioned guidelines will require more work and care while refactoring.
Be patient
Profiling is not fast, not easy, and not an exact process. What this means is that you should not expect to just run the profiler and expect the data from it to point directly to your problem. That could happen, yes. However, most of the time, the problems you're trying to solve are the ones that simple debugging couldn't fix. This means you'll be browsing through data, plotting it to try to make sense of it, and narrowing down the source of your problem until you either need to start again, or you find it.
Keep in mind that the deeper you get into the profiled data, the deeper into the rabbit hole you get. Numbers will stop making sense right away, so make sure you know what you're doing and that you have the right tools for the job before you start. Otherwise, you'll waste your time and end up with nothing but frustration.
Gather as much data as you can
Depending on the type and size of software you're dealing with, you might want to get as much data as you can before you start analyzing it. Profilers are a great source for this. However, there are other sources, such as server logs from web applications, custom logs, system resources snapshots (like from the OS task manager), and so on.
Preprocess your data
After you have all the information from your profilers, your logs, and other sources, you will probably need to preprocess the data before analyzing it. Don't shy away from unstructured data just because a profiler can't understand it. Your analysis of the data will benefit from the extra numbers.
For instance, getting the web server logs is a great idea if you're profiling a web application, but those files are normally just text files with one line per request. By parsing it and getting the data into some kind of database system (like MongoDB, MySQL, or the like), you'll be able to give that data meaning (by parsing the dates, doing geolocation by source IP address, and so on) and query that information afterwards.
The formal name for the stage is ETL, which stands for extracting the data from it's sources, transforming it into something with meaning, and loading it into another system that you can later query.
Visualize your data
If you don't know exactly what it is that you're looking for and you're just looking for ways to optimize your code before something goes wrong, a great idea to get some insight into the data you've already preprocessed is to visualize it. Computers are great with numbers, but humans, on the other hand, are great with images when we want to find patterns and understand what kind of insight we can gather from the information we have.
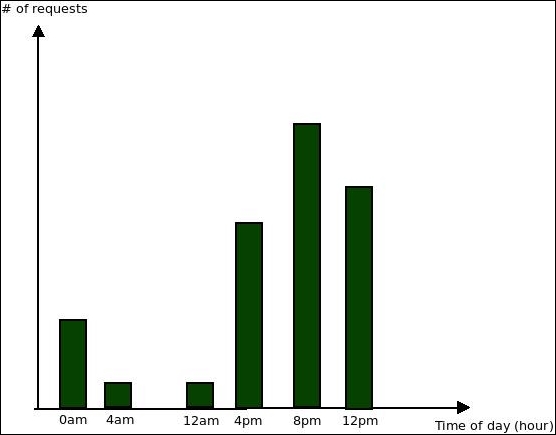
For instance, to continue with the web server logs example, a simple plot (such as the ones you can do with MS Excel) for the requests by hour can provide some insight into the behavior of your users:

The preceding chart clearly shows that the majority of requests are done during late afternoon and continue into the night. You can use this insight later on for further profiling. For instance, an optional improvement of your setup here would be to provide more resources for your infrastructure during that time (something that can be done with service providers such as Amazon Web Services).
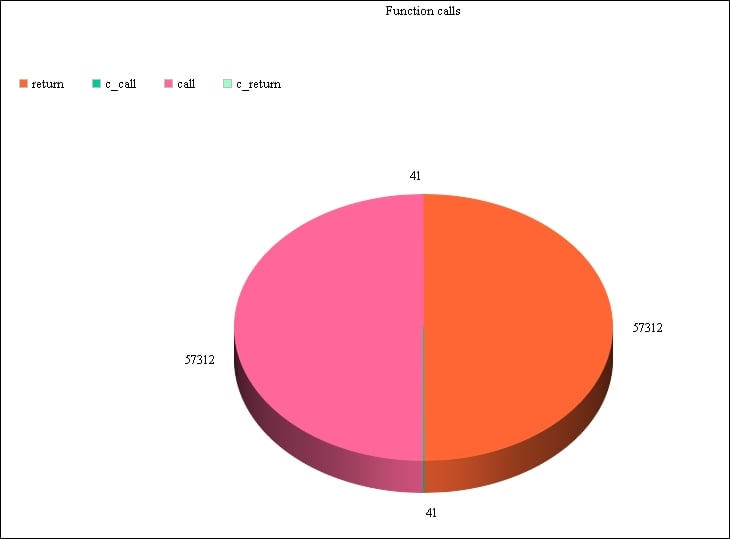
Another example, using custom profiling data, could be the following chart:

It uses data from the first code example of this chapter by counting the number of each event that triggers the profile function. We can then plot it and get an idea of the most common events. In our case, the call and return events are definitely taking up most of our program's time.


