Getting to know the SAP BO Dashboards interface
In this section, we will discuss the main interface panels, toolbars, and views. Let's have a look at the following screenshot, which describes the main interface areas in SAP BO Dashboards:

The main interface areas are:
- Canvas: We will use this area to place our dashboard components, such as charts, maps, and selectors.
- Excel model: We will use this embedded Excel model as a data container. Then, we will link our dashboard components to corresponding data cells in that Excel model. We can use this area exactly like a normal Excel file. We can add multiple sheets, use formulas, and use any Excel feature or option.
- Properties panel: This is a special panel, so it is located on the right-hand side, without any other interfering panels, by default. This panel will be the most used panel once you start working with Dashboards. The properties panel will display the properties for the currently selected component.
- Panel's area: We can access the remaining dashboard panels from this area. We can change the layout and order of these panels as we wish. We can also use the auto hide/pin feature to give us more space while working on the canvas and Excel model side. We have the following panels, which we will discuss in detail later:
- Object Browser
- Components
- Mobile Compatibility
- Query Browser
- Toolbars: We have the following toolbars:
- Standard
- Themes
- Export
- Format
- Start Page
- Menus: We can apply the same functions that are available through toolbars, using menus as well.
Here, we will focus on the dashboard panels, toolbars, and quick views.
Understanding SAP BO Dashboards panels
We have five main dashboard panels that we will use to facilitate our dashboard creation process. These panels are:
- Properties
- Component
- Object Browser
- Query Browser
- Mobile compatibility
Let's explore them one by one.
The Properties panel
The Properties panel, as we mentioned before, is the most important panel that we will use while creating our dashboards. We can use this panel to control the currently selected dashboard components' properties. For example, we can see the Properties panel for line chart component. I selected the line chart properties panel because it has almost all possible properties for a dashboard component. We should note that properties are common for many objects, and we can use them in the same way. So, we will try to understand how to configure each property, and this should work in the exact same way if you find this property in another component:

As we can see, properties are classified in tabs. Each tab contains some related properties, the Appearance tab for example, which contains all properties related to the layout, colors, size, and font. We will work through all the properties as we progress through the chapters. But for now, let's try to understand the main use of each property tab:
- General: We can set the general component properties from this tab, such as a chart title. We can also use this tab to link our component with the data presented in an Excel model. We will talk about this tab in detail in Chapter 3, UI Components.
- Insertion: This is an important feature that is available for some dashboard components. We can use this feature to interact with the dashboard and use one chart to drill to another. We already saw an example, while we were discussing the chart-Drill Down dashboard sample early in this chapter. We will talk in detail about this tab in Chapter 6, Advanced Interactive Analysis with Dashboards.
- Behavior: We can use this tab to control the selected component behavior, such as dynamic visibility, chart scale properties, and animations and effects. We will cover this tab in detail in Chapter 6, Advanced Interactive Analysis with Dashboards.
- Appearance: We can use this tab to control the look and feel of the selected components, such as the text color, background, and borders. We will discuss this tab in more detail in Chapter 7, Styling Up.
- Alerts: We can use this tab to set and configure the Alert feature for the selected dashboard components. We can use alerts to add more insight to our dashboard by comparing the currently achieved value against the targeted value. The comparison result will be compared against Alert Threshold and based on that, we can use an alerting mechanism, such as traffic light colors or icons. We will cover Alerts in more detail in Chapter 6: Advanced Interactive Analysis with Dashboards.
Next, we will discuss the Components panel.
The Components panel
We can consider the Components panel as our dashboard components library. Here, we will find all the available components that we can use.

There are three main display views for the dashboard components library:
- Category: The Components panel will display Dashboard components by category such as Charts, Selectors, and Maps. When you click on a category, it will expand to show the components under this category. A thumbnail will be displayed for each dashboard component, to give an idea about what that component is. This is the main advantage of this display view. On the other hand, thumbnails will take a larger space to display on the screen, and hence we can see a fewer number of components at the same time.
- Tree: This display view is exactly the same as the previous one, but the dashboard components will be displayed in a Hierarchical folder tree structure. Each component will be displayed as an icon rather than a thumbnail. This view will give extra space to see more dashboard components at the same time.
- List: All dashboard components are sorted alphabetically in this view and presented like an icon. We can use this display view if we know the exact name of our dashboard components.
Tip
If you are a beginner, then the Category view will be your favorite display view because it will give you a good idea about the Dashboard component, even before dragging it to the canvas. If you have experience, then the list view will be best for you, as you will be able to reach your dashboard component faster.
You can use Ctrl + 5 to open the Components panel or use the menu bar: View | Components.
We can use the component filter to display All components or Mobile Only components.

You can refer to the Appendix for a list of all the Mobile-compatible dashboard components.
Tip
You can add the most frequent dashboard components to your Favorite folder or category for fast access for future use.
We can see the steps to add dashboard components to your favorites in the following screenshot:

Next, we will discuss the Object Browser panel.
The Object Browser panel
We can use the Object Browser panel to manage a large number of canvas's dashboard components. This panel is very common in graphic design tools, such as Adobe PhotoShop, and it is used for the same purpose. We can use Object Browser to execute one of the following actions:
- To Select/Rename the dashboard components
- To Delete the dashboard components
- To Show/Hide a dashboard component at design time
- To Lock/Unlock a dashboard component at design time
- To change the dashboard components' display order
Tip
We can use Ctrl + 4 or navigate to View | Object Browser from the menu bar to open this panel.
We can see the Object Browser window in the following screenshot:

The Query Browser panel
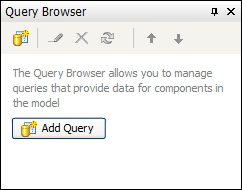
This panel is used to manage direct Universe queries. Universe is a SAP BusinessObjects semantic layer, and it acts like an intermediate layer between database and business. We can use this panel to create a new query or manage existing queries, such as edit, delete, refresh, and reorder. We can see the Query Browser panel in the following screenshot:

We will discuss this panel in detail in Chapter 9, Retrieving External Data Sources.
Mobile compatibility
We will use this panel to track our dashboard's compatibility with mobile devices. We need to note that "Mobile" here is not only referring to cell phones, but it is referring to all Mobile devices, especially tablets. We will cover this in detail in Chapter 11, Creating Mobile Dashboards.
We will use the Mobile Compatibility panel to get information and warnings on unsupported dashboard components, features, and connections.
We can see the Mobile Compatibility panel in the following screenshot:

In the next section, we will talk about dashboard toolbars and menus.
Understanding SAP BO Dashboards toolbars
SAP BO Dashboards is a visual design program that contains many toolbars. A toolbar is a fast way to access different features and options, such as keyboard shortcuts. However, in toolbar's case, we don't need to remember the shortcuts. Also, keyboard shortcuts are not available for all options, and so toolbars are the easiest way to access options and features. We can show/hide a toolbar from the view menu, as shown in the following screenshot.
We have the following toolbars:
- Standard
- Themes
- Export
- Format
- Start Page

So, let's discuss each one in more detail.
The Standard toolbar
The Standard toolbars provide us with the standard options, such as new, open, and save. We can access the quick view menus from this toolbar as well. We will discuss the quick view menus in more detail later on. We can also use the Preview button to preview our dashboard. We can see the Standard toolbar in the following screenshot:

The Themes toolbar
We can use the Themes toolbar to change the current dashboard theme or color pallet. We can see the Themes toolbar in the following screenshot:

The Export toolbar
We can use this toolbar to export our dashboard to PowerPoint, Word, Outlook, or PDF file, as shown in the following screenshot:

The Format toolbar
We can use the Format toolbar to group or ungroup dashboard components, dashboard components' alignment, and control components' order.
Note
For those of you who have experience with Microsoft PowerPoint, this toolbar might look familiar.
We can see the toolbar in the following screenshot:

The Start Page toolbar
We can open the Start Page toolbar using the Start Page icon. Start page can be used to access recently opened documents, and access useful information about the main features of SAP BO Dashboards. We can see this in the following screenshot.

We can use a start page to access the recently opened documents, and to open the start page that contains much useful information about the main features of SAP BO Dashboards.
Understanding SAP BO Dashboards quick views
Quick Views are a very nice feature that can help the dashboard developer/designer focus on a specific area in the workspace. As we can see, we already have many panels, toolbars, and menus beside the Canvas and Excel model, which makes our workspace very crowded. In fact, you will not need to see all of them together most of the time. We can see the Quick Views menu in the following screenshot:

We have the following quick views in SAP BO Dashboards:
- Show My Workspace: This quick view will display Canvas, the Excel model, and the Properties panel on the right-hand side, and the Components panel on the left-hand side
- Show Canvas Only: This will display only the Canvas to help us focus on the design part, such as dashboard components place, alignments, and so on
- Show Spreadsheet Only: This view will help us focus on the Excel model, formulas, and data
- Show Canvas and Spreadsheet: This view will help us focus on both the Canvas and Excel model, and is a combination of the previous two options


