In ACT! CRM, dashboards allow you to access key information in the form of a graphical interface. You can filter a Dashboard so that it contains just the information you need, or you can tweak the various elements of a Dashboard to give it a different look. Administrators and Managers of your ACT! database can create brand new Dashboards if they're required.
If you want more details about the information you see in a Dashboard, you can drill-down into the Dashboard with a simple double-click to access all the juicy details. At that point, you can edit or add to your information and the Dashboard will update automatically.
You can even print out a hard copy of a Dashboard to preserve the contents for posterity. Because many of the Dashboards consist of pie charts and graphs, you might even want to copy one of them and paste it into other applications such as Word, Excel, or PowerPoint.
Getting familiar with the Dashboard layouts
Quite simply, a Dashboard is a graphical interface that gives you a visual snapshot of a part of your business. ACT! Dashboards let you view and work with the various information contained in your database in one easy-to-access location. Dashboards can take the form of charts, graphs, or even lists. Dashboards are associated with a database and not a user; therefore all users share the same Dashboards. However, you can select your own Dashboard view in much the same way that you can select a layout. You can also filter the information that is shown in your Dashboard.
A Dashboard consists of two parts:
- The Dashboard layout: The Dashboard layout determines which Dashboard components you see and how the filters are set. ACT! comes with six Dashboard layouts. However, Managers and Administrators can create additional Dashboard layouts using the Dashboard Designer or make permanent changes to the existing ones.
- Dashboard components: Each Dashboard layout consists of one or more components. A component displays different types of data from the ACT! database. For example, a Dashboard layout might include a component that lists a user's top 10 current sales opportunities, another component that graphs the activities of a specific user, and a component that displays a pie chart of the company's current pipeline. A layout can have a maximum of six components.
Getting ready
In order to really take advantage of the ACT! Dashboard, you'll need to make sure that your database contains a variety of information. Specifically you'll need to make sure that your database contains a few Contacts, Activities, and Opportunities if you're going to view any of those Dashboards.
How to do it...
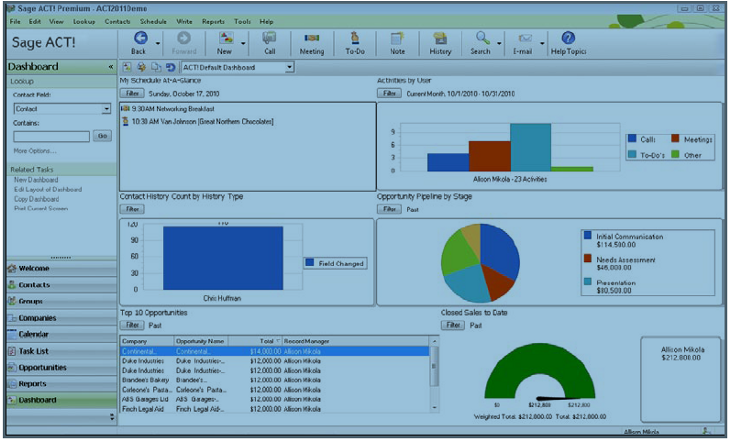
- Click the Dashboard icon on ACT!'s navigation bar. The following screenshot shows you an example of the default Dashboard page:
- Choose the Dashboard layout you want from the Dashboard drop-down list, at the top-left side of the Dashboard.
How it works...
Many of the layouts consist of the exact same components. However, the components in each of the layouts are filtered differently, giving the layouts a bit of variety.
There's more...
Out of the box there are five Dashboard layouts:
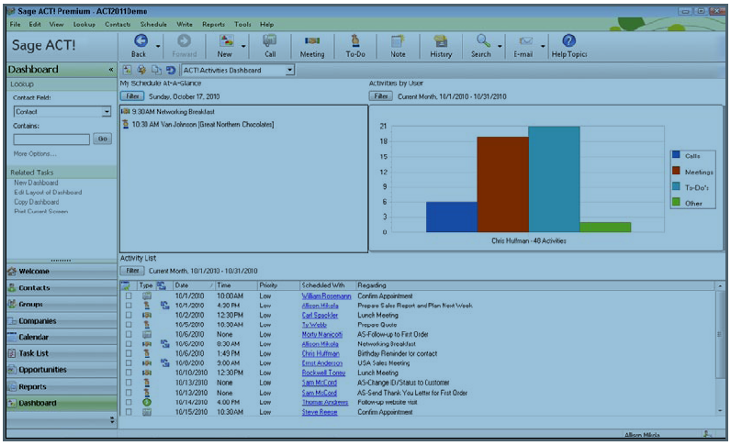
- ACT! Activities Dashboard: Shows the activities of the user currently signed into ACT!, like the one you see in the following screenshot:
- ACT! Administration Dashboard: Lists the database users and shows when they've logged in and out of the database. Also lists any remote sync users, the date of their list sync, and how many days they have before their remote database expires if they don't synchronize.
- ACT! Contact Dashboard: Gives you a list of recently created contacts, recently edited contacts, and the number of fields that have changed.
- ACT! Default Dashboard: Includes three activity and three opportunity components.
- ACT! Opportunities Dashboard: Provides you with four different opportunity components including sales analysis by stage, value, and product.
Unlock access to the largest independent learning library in Tech for FREE!
Get unlimited access to 7500+ expert-authored eBooks and video courses covering every tech area you can think of.
Renews at €18.99/month. Cancel anytime
Each Dashboard layout is actually a file ending with the .dsh extension. You'll find them safely filed in the Dashboards sub-folder of the database files folder associated with your database.
Accessing information from Dashboards
Once you've become familiar with the various Dashboard layouts your next step is to start exploring the components found in each layout to see what data they contain. The components are generally arranged in a grid of two columns of three rows for a total of six components per Dashboard layout.
The basic components include:
- My Schedule At-A-Glance: Found on the Default and Activities Dashboards, this component lists your activities of the current user for the current day.
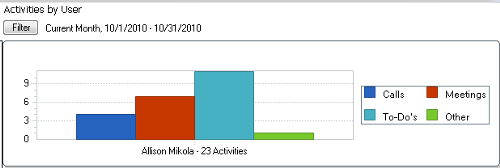
- Activities by User: Found on the Default and Activities Dashboards, this component displays the activities for the current user for the current month, sorted by type, in a bar chart. The total numbers of activities are shown in the following screenshot. In addition you can hover your mouse over a bar section to see the number of activities for that activity type.
- Activity List: Found on the Activities Dashboard, this component is identical to the My Schedule At-A-Glance components, except that it lists all the activities for the current month.
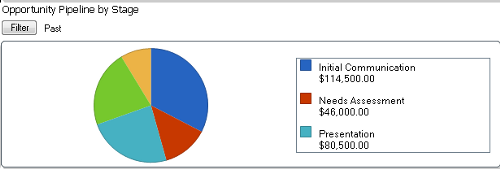
- Opportunity Pipeline by Stage: Found on the Opportunities and Default Dashboards, this component displays your open opportunities in the ACT! Sales Cycle process for the current month sorted by stage, in a pie chart and includes a recap on the side like the one you see in the following screenshot:
- Contact History Count by User Type: Found on the Contacts Dashboard this component displays history items created by database users within a specified number of days similar to what's shown in the following screenshot:

- Opportunities - Open by Product: Found on the Opportunities Dashboard, the component displays a pie chart of the open opportunities by product and by user.
- Top 10 Opportunities: Found on the Opportunities and Default Dashboards, this component displays a list, by company and opportunity name, of the top ten open opportunities in the ACT! Sales Cycle process for the current month.
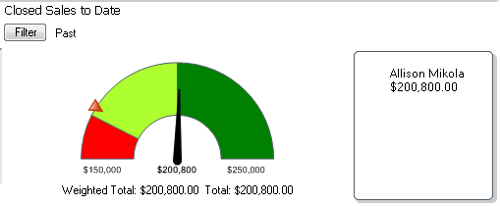
- Closed Sales to Date: Found on the Opportunities and Default Dashboards, this component displays the weighted and total value of opportunities in the ACT! Sales Cycle process, you closed and won in the form of a chart. Optionally you can customize the component to indicate a sales goal like the one shown in the following screenshot:
 United States
 Great Britain
 India
India
 Germany
 France
 Canada
 Russia
 Spain
Spain
 Brazil
 Australia
 Singapore
 Hungary
 Ukraine
 Luxembourg
 Estonia
 Lithuania
 South Korea
 Turkey
 Switzerland
 Colombia
 Taiwan
 Chile
Chile
 Norway
 Ecuador
 Indonesia
 New Zealand
 Cyprus
 Denmark
 Finland
 Poland
 Malta
Malta
 Czechia
 Austria
 Sweden
 Italy
Italy
 Egypt
Egypt
 Belgium
 Portugal
 Slovenia
 Ireland
 Romania
 Greece
 Argentina
 Netherlands
 Bulgaria
 Latvia
 South Africa
 Malaysia
 Japan
Japan
 Slovakia
 Philippines
 Mexico
 Thailand


