
When you hover over a point in your view, a tooltip will appear. Tooltips are small boxes, holding detailed information about a data point in the view, and are present by default. In this recipe, you will learn how to customize tooltips.
Customizing tooltips
Getting ready
To follow this recipe, connect to the Baby_names.csv data source and open a new worksheet.
How to do it...
- Drag and drop Frequency from Measures onto Size in the Marks card.
- Drag and drop State from Dimensions onto Detail in the Marks card.
- Drag and drop State from Dimensions onto Label in the Marks card.
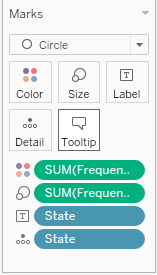
- Drag and drop Frequency from Measures to Color in the Marks card.
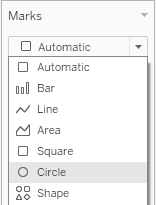
- Click on the drop-down menu in the Marks card and select Circle:
- Drag and drop Name from Dimensions into the Filter shelf.
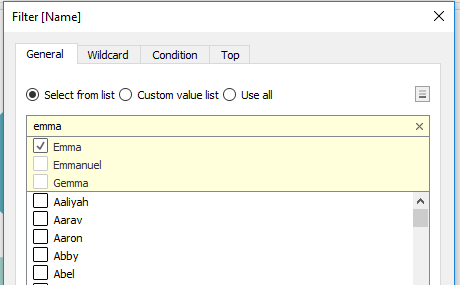
- In the Filter [Name] window, click None to deselect all values.
- Start typing emma in the search bar at the top of the list, select Emma, and click on OK:
- Drag and drop Gender from Dimensions onto Detail in the Marks card.
- Drag and drop Name from Dimensions onto Tooltip in the Marks card.
- Double-click on Tooltip in the Marks card.
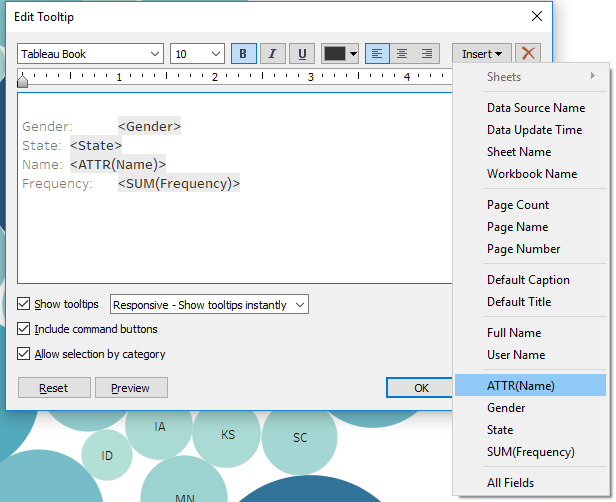
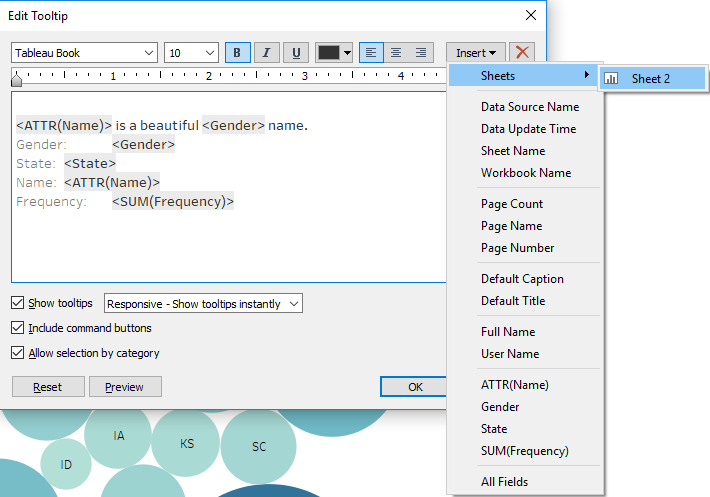
- In the Edit Tooltip window, hit Enter to add a row above the existing text and place your cursor in the new row.
- Click on Insert and select ATTR(Name):
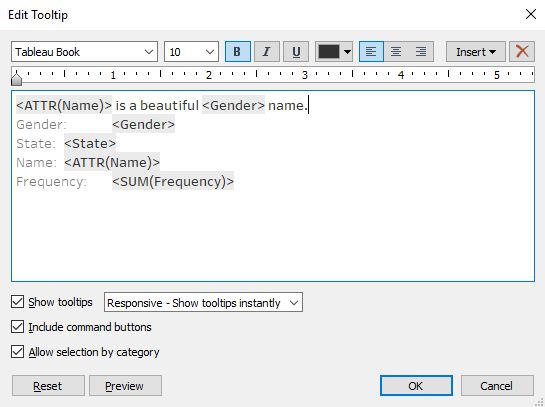
- Click on Insert again and select Gender.
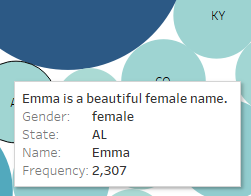
- Between <ATTR(Name)> and <Gender>, type is a beautiful. After <Gender>, type name. The whole expression should be <ATTR(Name)> is a beautiful <Gender> name, as shown in the following screenshot:
- Click on OK. The expression we entered into the tooltip will now appear when you put your mouse over any of the circles:
How it works...
Tooltips are, by default, set to hold information on the fields that are in the view and their current values. However, as we just saw, you can customize them by adding additional elements, or removing the ones that are there by default. We inserted fields such as Name and Gender into the Tooltip section; they will change automatically. If we change the Name filter from Emma to another name, it will change the value of the name in the sentence, as well as automatically update the gender.
There's more...
You can also insert another worksheet from the workbook into the tooltip. Let’s say you want your user to be able to see where the particular state is on the map. We can do this by executing the following steps:
- Create another sheet with the map, just by opening a blank worksheet and double-clicking on State in Dimensions.
- On the original sheet, double-click on Tooltip to open the Edit Tooltip window and add an empty row:
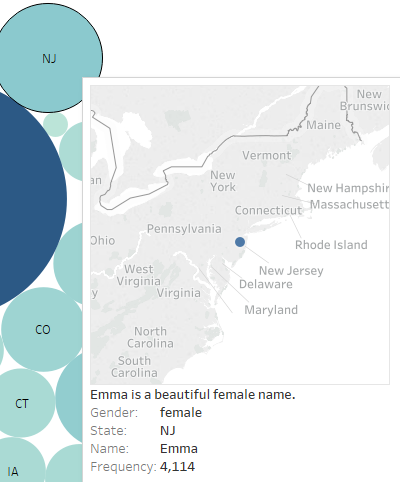
- Click on Insert and navigate to Sheets | Sheet 2. Tableau will insert an expression referencing Sheet 2 into the Tooltip section:
- If you go to Sheet 2, you will notice that Tableau added Tooltip (State) as a filter. When your mouse cursor goes over any of the states in Sheet 1, a tooltip with a map marking that state will show up:
See also
- For more information on formatting tooltips, refer to the following Tableau Help page at https://onlinehelp.tableau.com/current/pro/desktop/en-us/formatting_specific_titlecaption.html