
Maps are a great way to present geographical data, as they are intuitive and easy to read. In this recipe, we will show name frequency by state, but this time using a map. This recipe will cover two frequently used ways to present data on a map: creating a map with circles of different sizes, and creating a filled map with a color gradient.
Building a map
Getting ready
To complete this recipe, you will need to connect to the Baby_names.csv dataset and open a new blank worksheet.
How to do it...
First, we will make a map with circles.
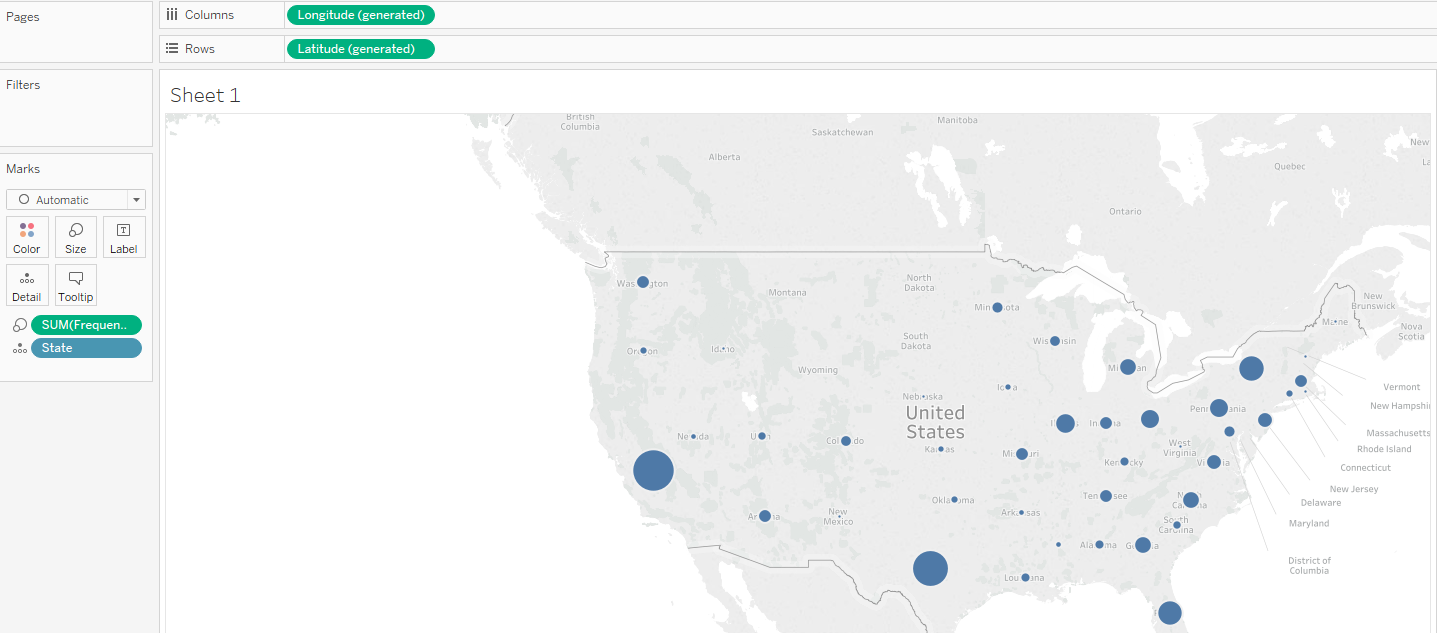
Creating a map with circles
- Drag and drop State into the worksheet workspace.
- Drag and drop Frequency onto Size in the Marks card.
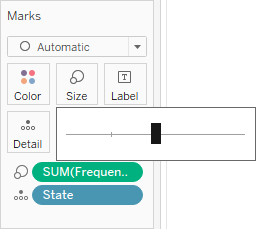
- Click on Size in the Marks card, and move the slider to the center, through which we can increase and decrease the size of the circle in the following map:
You can see the results in the following screenshot:
If the map is failing to display, navigate to File|Workbook Locale in the main menu toolbar and select More.... When the Set Workbook Locale window opens, select English (United States).
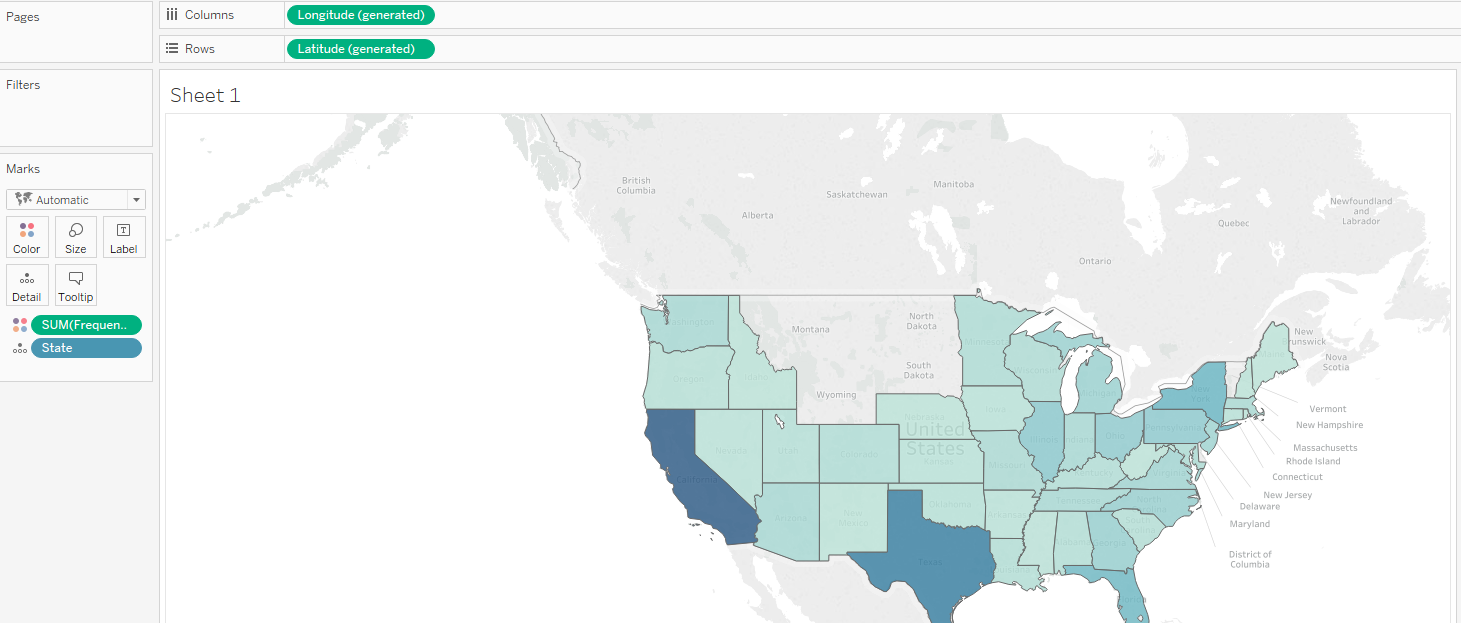
Creating a map with a color gradient
- Drag and drop State into the worksheet workspace.
- Drag and drop Frequency onto Color in the Marks card:
How it works...
Tableau has correctly recognized that the State dimension contains geographical information, and has assigned a geographical role to it. This is indicated by a small globe symbol ( ) next to the dimension name in the Dimensions pane, as well as in the data preview on the Data Source page. Based on that, it has automatically generated two new measures, which are not in the dataset itself: Longitude and Latitude. When you drag and drop the State dimension into the worksheet workspace, the Show Me functionality is implemented. It places State in Detail in the Marks card, Longitude into the Columns shelf, and Latitude into the Rows shelf. Based on what we do with our measure, Frequency, Tableau automatically chooses the appropriate mark type, which is a circle or a map.
There's more...
It is possible to add and subtract layers from a map and change the map style by performing the following steps:
- From the main menu toolbar, navigate to Map | Map Layers… to open the Map Layers pane:
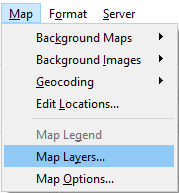
- In the Map Layers pane, you can add and remove map layers by checking and deselecting the boxes in front of them:
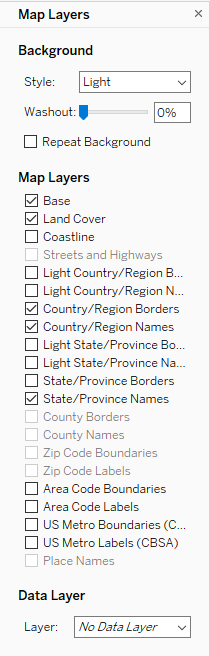
- You can also add data layers by selecting them from the Data Layer drop-down menu. Depending on the data you are showing on your map, adding different data layers might add relevant information to your visualization.
- It's also possible to adjust the background style under Background.
- Set the map style and layers as default. This means that every time you create a new map, those settings will be applied.
See also
- For more on maps, see the Tableau Help page on this topic at https://onlinehelp.tableau.com/current/pro/desktop/en-us/maps_build.html