Creating an analytic view
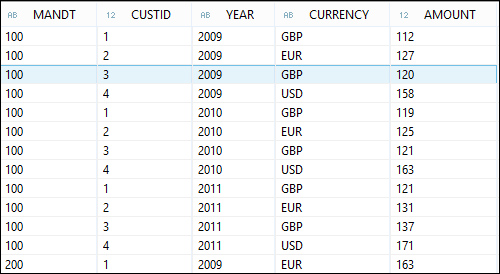
Let's start by creating a simple analytic view, so we can see how it works. Like an attribute view, we first need to identify the table which contains the information we are to work with. In our example data, we have a REVENUE table which contains CUSTID, YEAR, CURRENCY, and AMOUNT. As the column names suggest, this data represents the revenue, per customer, per year. Each AMOUNT is shown in a given CURRENCY, as we can see in the following screenshot:

Once again, data exists from two clients, 100 and 200, so we'll need to filter on one of them to get something meaningful.
To create an analytic view, open the Quick Launch panel and navigate to Analytic View | Create.
Tip
If you can't find the Quick Launch panel, then you might not have the Studio's Modeler perspective open. If this is the case, navigate to Window | Open Perspective | Modeler, or navigate to Window | Open Perspective | Other | Modeler. This will open the panels you last opened when you did modeling tasks...


