Search icon CANCEL
Subscription
0
Cart icon
Your Cart (0 item)
Close icon
You have no products in your basket yet
Save more on your purchases! discount-offer-chevron-icon
Savings automatically calculated. No voucher code required.
Arrow left icon
Explore Products
Best Sellers
New Releases
Books
Videos
Audiobooks
Learning Hub
Free Learning
Arrow right icon
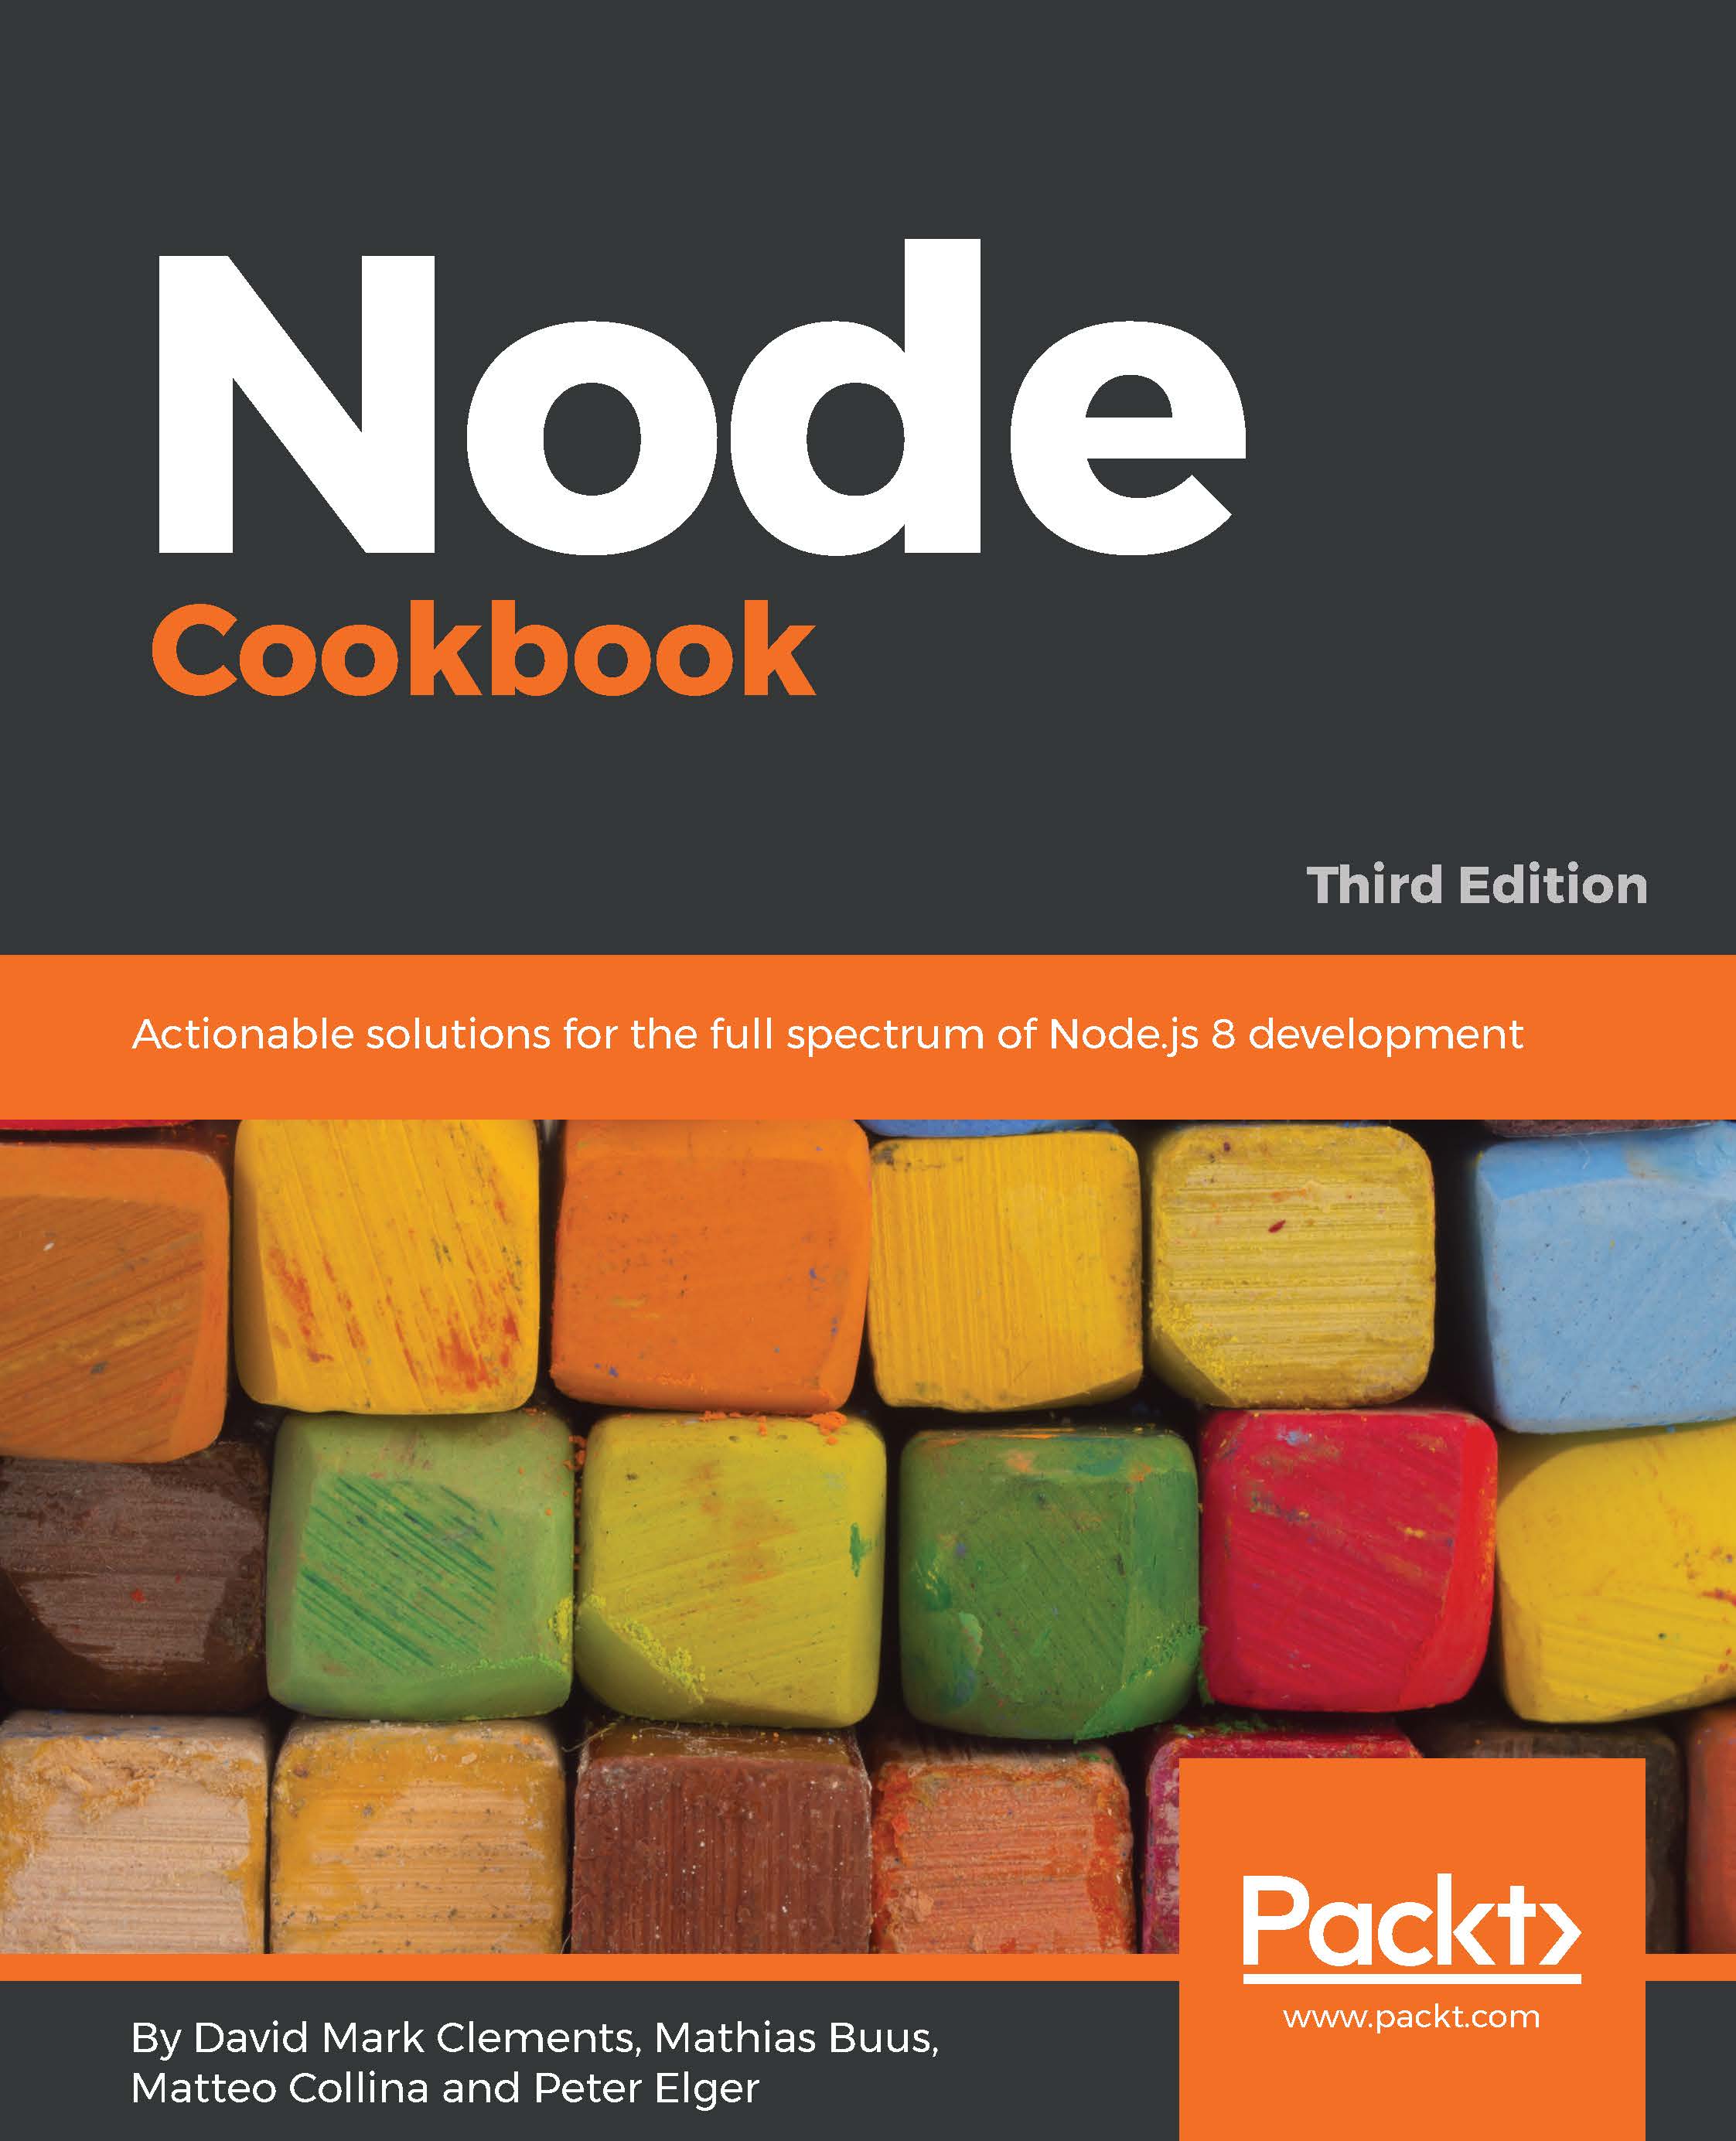
Node Cookbook
Node Cookbook

Node Cookbook: Actionable solutions for the full spectrum of Node.js 8 development , Third Edition

Arrow left icon
Profile Icon David Mark Clements Profile Icon Mathias Buus Madsen Profile Icon Elger Profile Icon Matteo Collina
Arrow right icon
€41.99
Full star icon Full star icon Full star icon Full star icon Half star icon 4.7 (3 Ratings)
Paperback Jul 2017 656 pages 3rd Edition
eBook
€8.99 €32.99
Paperback
€41.99
Subscription
Free Trial
Renews at €18.99p/m
eBook
€8.99 €32.99
Paperback
€41.99
Subscription
Free Trial
Renews at €18.99p/m

What do you get with Print?

Product feature icon Instant access to your digital eBook copy whilst your Print order is Shipped
Product feature icon Paperback book shipped to your preferred address
Product feature icon Download this book in EPUB and PDF formats
Product feature icon Access this title in our online reader with advanced features
Product feature icon DRM FREE - Read whenever, wherever and however you want
OR
Modal Close icon
Payment Processing...
tick Completed

Shipping Address

Billing Address

Shipping Methods
Table of content icon View table of contents Preview book icon Preview Book

Node Cookbook

Debugging process*

This chapter covers the following recipes:

  • Debugging Node with Chrome Devtools
  • Enhancing stack trace output
  • Enabling debug logs
  • Enabling core debug logs

Introduction

Debugging JavaScript has traditionally been non-trivial. This is partly to do with evented asynchronous paradigms inherent in the programming model and partly to do with tooling (and the difficulties in creating tooling that is well matched with JavaScript's programming model).

In recent years, however, as JavaScript usage has exponentially increased in both browser and server-side development, tooling has improved and continues to improve.

In this chapter, we talk about how to use fundamental debugging tools, introduce some additional useful introspection resources, and delve deeper into advanced production debugging tools and techniques such as async tracing and postmortems.

Debugging Node with Chrome Devtools

Node 6.3.0 onwards provides us with the --inspect flag, which we can use to debug the Node runtime with Google Chrome's Devtools.

Debugging legacy Node
This recipe can be followed with older versions of Node prior to Node 6.3.0 – it just requires a little more set up. To follow this recipe with a legacy version of Node, jump to Using node-inspector with older Node versions in the There's more... section of this recipe first.

In this recipe, we're going to diagnose and solve a problem in a simple Express application.

Getting ready

We're going to debug a small web server, so let's create that real quick.

On the command line, we execute the following commands:

$ mkdir app
$ cd app
$ npm init -y
$ npm install --save express
$ touch index.js future.js past.js
  

Our index.js file should contain the following:

const express = require('express') 
const app = express() 
const past = require('./past') 
const future = require('./future') 
 
app.get('/:age', (req, res) => { 
  res.send(past(req.params.age, 10) + future(req.params.future, 10)) 
}) 
 
app.listen(3000) 

Our past.js file should look like this:

module.exports = (age, gap) => { 
  return `${gap} years ago you were ${Number(age) - gap}<br>` 
} 

And our future.js file should be as follows:

module.exports = (age, gap) => {
return `In ${gap} years you will be ${Number(age) + gap}<br>`
}
Web frameworks
We're only using Express here as an example. To learn more about Express and other frameworks, see Chapter 7, Working With Web Frameworks.

How to do it...

When we run our server (which we created in the Getting ready section), and navigate our browser to http://localhost:3000/31 , the output is as follows:

10 years ago you were 21 
In 10 years you will be NaN 

It looks like we have a Not a Number problem.

Let's start our server in inspection mode:

$ node --inspect index.js

This will output a message that the debugger is listening.

We can connect to the debugger using the Chrome browser. Let's open Chrome and navigate to chrome://inspect.

Ensuring that we're in the Devices tab, we should be able to see our Node process underneath the Remote Target section, as in the following screenshot:

We should then see something like the following:

The module wrapper
Notice that the Devtools Code section shows an additional outer function wrapping the code we placed into index.js. This outer function is added at runtime to each code file loaded into the process (either by directly starting the file with node or by using require to load it). This outer function is the module wrapper, it's the mechanism Node uses to supply local references like module and __filename that are unique to our module without polluting global scope.

Now let's set a breakpoint inside our route handler, on line 7.

If we click the number 7 in the LOC column to the left of the code, an arrow shape will appear over and around the number (which will turn white). Over in the right-hand column, in the Breakpoints pane we should also see a checkbox with index.js:7 next to it, while beneath that is the code from the line we've set a breakpoint on.

In short, the Devtools GUI should now look something like the following:

Now let's open a new tab and navigate to http://localhost:3000/31:

This will cause the breakpoint to trigger, and Devtools will immediately grab focus.

The next thing we see should look like the following:

We can see line 7 is now highlighted, and there's a sort of tooltip showing us the values of the req and res objects on the line above.

Over in the right column, the Call Stack panel is full of call frames (the functions in the stack), and there's now a blue play button in the control icons at the top of the right column. If we were to scroll the right column, we'd also see the Scope pane is populated with references.

The debugger is waiting for us to allow execution to proceed, and we can chose whether to step over, in, or out of the next instruction.

Let's try stepping in. This is the down arrow pointing to a dot, the third icon from the left in the controls section:

When we press this, we step into the past function, which is in the past.js file, so Devtools will open a new tab in the center code panel and highlight the line that is about to execute (in our case, line 2):

So let's step out of the past function by pressing the arrow pointing up and away from a dot, next to the step-in icon:

The second line of the output seems to have the issue, which is our future function.

Now that we've stepped out, we can see that the call to future is highlighted in a darker shade of blue:

Now let's press the step-in icon again, which will take us into the future function in the future.js file:

Okay, this is the function that generates that particular sentence with the NaN in it. A NaN can be generated for all sort of reasons, such as dividing zero by itself, subtracting Infinity from Infinity, trying to coerce a string to a number when the string does not hold a valid number, to name a few. At any rate, it's probably something to do with the values in our future function.

Let's hover over the gap variable. We should see the following:

Seems fine. Now let's hover over the age variable:

Wait... why does that say undefined ? We vicariously passed 31 by navigating to http://localhost:3000/31.

To be sure our eyes aren't deceiving us, we can double-check by collapsing the Call Stack section (by clicking the small downwards arrow next to the C of Call Stack). This will make room for us to easily see the Scope section, which reports that the age variable is indeed undefined, as in the following screenshot:

Well, Number(undefined) is NaN, and NaN + 10 is also NaN.

Why is age set to undefined?

Let's open up the Call Stack bar again and click the second row from the top (which says app.get).

We should be back in the index.js file again (but still frozen on line 2 of future.js), like so:

Now let's hover over the value we're passing in to future:

That's undefined too. Why is it undefined?

Oh. That should be req.params.age, not req.params.future. Oops.

To be absolutely sure, let's fix it while the server is running. If we hit the blue play button once we should see something like this:

Now let's click line 7 again to remove the breakpoint. We should be seeing:

Now if we click immediately after the e in req.params.future we should get a blink cursor. We backspace out the word future and type the word age, making our code look like this:

Finally, we can live save those changes in our running server by pressing Cmd + S on macOS, or Ctrl + S on Windows and Linux.

Finally, let's check our route again:

OK, we've definitely found the problem, and verified a solution.

How it works...

We don't really need to know how debugging Node with devtools is made possible in order to avail ourselves of the tool, however, for the curious here's a high-level overview.

Debugging ability is ultimately provided by V8, the JavaScript engine used by Node. When we run node with the --inspect flag, the V8 inspector opens a port that accepts WebSocket connections. Once a connection is established, commands in the form of JSON packets are sent back and forth between the inspector and a client.

The chrome-devtools:// URI is a special protocol recognized by the Chrome browser that loads the Devtools UI (which is written in HTML, CSS, and JavaScript, so can be loaded directly into a normal browser tab). The Devtools UI is loaded in a special mode (remote mode), where a WebSocket endpoint is supplied via the URL.

The WebSocket connection allows for bi-directional communication between the inspector and the client. The tiny Inspector WebSocket server is written entirely in C and runs on a separate thread so that when the process is paused, the inspector can continue to receive and send commands.

In order to achieve the level of control we're afforded in debug mode (ability to pause, step, inspect state, view callstack, live edit) V8 operations are instrumented throughout with Inspector C++ functions that can control the flow, and change state in place.

For instance, if we've set a breakpoint, once that line is encountered, a condition will match in the C++ level that triggers a function that pauses the event loop (the JavaScript thread). The Inspector then sends a message to the client over the WebSocket connection telling it that the process is paused on a particular line and the client updates its state. Likewise, if the user chooses to step into a function, this command is sent to the Inspector, which can briefly unpause and repause execution in the appropriate place, then sends a message back with the new position and state.

There's more...

Let's find out how to debug older versions of Node, make a process start with a paused runtime and learn to use the built-in command-line debugging interface.

Using node-inspector with older Node versions

The --inspect flag and protocol were introduced in Node 6.3.0, primarily because the V8 engine had changed the debugging protocol. In Node 6.2.0 and down, there's a legacy debugging protocol enabled with the --debug flag, but this isn't compatible with the native Chrome Devtools UI.

Instead, we can use the node-inspector tool, as a client for the legacy protocol.

The node-inspector tool essentially wraps an older version of Devtools that interfaces with the legacy debug API, and then hosts it locally.

Let's install node-inspector:

$ npm i -g node-inspector

This will add a global executable called node-debug, which we can use as shorthand to start our process in debug mode.

If we could run our process like so:

$ node-debug index.js

We should see output that's something like the following:

Node Inspector v0.12.10
Visit http://127.0.0.1:8080/?port=5858 to start debugging.
Debugging `index.js`
    
Debugger listening on [::]:5858

When we load the URL http://127.0.0.1:8080/?port=5858 in our browser we'll again see the familiar Devtools interface.

By default, the node-debug command start our process in a paused state. After pressing run (the blue play button), we should now be able to follow the main recipe in it's entirely using a legacy version of Node.

Immediately pausing a process on start

In many cases, we want to debug a process from initialization, or we may want to set up breakpoints before anything can happen.

From Node 8 onwards, we use the following to start Node in an immediately paused state:

$ node --inspect-brk index.js

In Node 6 (at time of writing, 6.10.0), --inspect is supported but --inspect-brk isn't. Instead, we can use the legacy --debug-brk flag in conjunction with --inspect like so:

$ node --debug-brk --inspect index.js

In Node v4 and lower, we'd simply use --debug-brk instead of --debug (in conjunction with another client, see Using Node Inspector with older Node versions)

node debug

There may be rare occasions when we don't have easy access to a GUI. In these scenarios, command-line abilities become paramount.

Let's take a look at Nodes, built in command-line debugging interface.

Let's run our app from the main recipe like so:

$ node debug index.js

When we enter debug mode, we see the first three lines of our entry point (index.js).

Upon entering debug mode, the process is paused on the first line of the entry point. By default, when a breakpoint occurs the debugger shows two lines before and after the current line of code, since this is the first line we only see two lines after.

The debug mode provides several commands in the form of functions, or sometimes as magic getter/setters (we can view these commands by typing help and hitting Enter).

Let's get a little context using the list function:

debug> list(10) 

This provides 10 lines after our current line (again it would also include 10 lines before, but we're on the first line so there's no prior lines to show).

We're interested in the seventh line, because this is the code that's executed when the server receives a request.

We can use the sb function (which stands for Set Breakpoint) to set a break point on line 7, like so:

debug> sb(7)  

Now if we use list(10) again, we should see an asterisk (*) adjacent to line 7:

debug> list(10)  

Since our app began in paused mode, we need to tell the process to begin running as normal so we can send a request to it.

We use the c command to tell the process to continue, like so:

debug> c 

Now let's make a request to our server, we could use a browser to do this, or if we have curl on our system, in another terminal we could run the following:

$ curl http://localhost:3000/31 

This will cause the process to hit our breakpoint and the debugger console should print out break in index.js:7 along with the line our code is currently paused on, with two lines of context before and after. We can see a right caret (>) indicating the current line:

Now let's step in to the first function. To step in, we use the step command:

debug> step

This enters our past.js file, with the current break on line 2.

We can print out references in the current debug scope using the exec command, let's print out the values of the gap and age arguments:

debug> exec gap
debug> exec age

Everything seems to be in order here.

Now let's step back out of the past function. We use the out command to do this, like so:

debug> out 

We should now see that the future function is a different color, indicating that this is the next function to be called. Let's step into the future function:

debug> step

Now we're in our future.js file, again we can print out the gap and age arguments using exec:

debug> exec gap
debug> exec age

Aha, we can see that age is undefined. Let's step back up into the router function using the out command:

debug> out 

Let's inspect req.params.future and req.params:

debug> req.params.future
debug> req.params  

It's now (again) obvious where the mistake lies. There is no req.params.future; that input should be req.params.age.

See also

  • Creating an Express web app, in Chapter 7, Working with Web Frameworks
  • Writing module code, in Chapter 2, Writing Modules
  • Profiling memory, in Chapter 9, Optimizing Performance
  • CPU profiling with Chrome Devtools, in the There's more... section of Finding Bottlenecks with Flamegraphs, in Chapter 9, Optimizing Performance

Enhancing stack trace output

When a Node process experiences an error, the function where the error occurred, and the function that called that function (and so on) is written to STDERR as the final output of the application.

This is called a stack trace. By default, Node's JavaScript engine (V8) retains a total of 10 frames (references to functions in a stack).

However, in many cases we need far more than 10 frames to understand the context from a stack trace when performing root-cause analysis on a faulty process. On the other hand, the larger the stack trace, the more memory and CPU a process has to use to keep track of the stack.

In this recipe, we're going to increase the size of the stack trace, but only in a development environment.

Getting ready

Let's prepare for the recipe by making a small application that causes an error creating a long stack trace.

We'll create a folder called app, initialize it as a package, install express, and create three files, index.js, routes.js, and content.js:

$ mkdir app
$ cd app
$ npm init -y
$ npm install express
$ touch index.js routes.js content.js

Our index.js file should look like this:

    const express = require('express')
    const routes = require('./routes')
    const app = express()
    
    app.use(routes)
    
    app.listen(3000)

The routes.js file like the following:

    const content = require('./content')
    const {Router} = require('express')
    const router = new Router()
    
    router.get('/', (req, res) => {
      res.send(content())
    })
    
    module.exports = router

And the content.js file like so:

function content (opts, c = 20) { 
  return --c ? content(opts, c) : opts.ohoh 
} 
 
module.exports = content 

How to do it...

Let's begin by starting our server:

$ node index.js

All good so far. Okay let's send a request to the server, we can navigate a browser to http://localhost:8080 or we can use curl (if installed) like so:

$ curl http://localhost:3000/

That should spit out some error HTML output containing a stack trace.

Even though an error has been thrown, the process hasn't crashed because express catches errors in routes to keep the server alive.

The terminal window that's running our server will also have a stack trace:

We can see (in this case) that the content function is calling itself recursively (but not too many times, otherwise there would be a Maximum call stack size exceeded error).

The content function looks like this:

function content (opts, c = 20) { 
  return --c ? content(opts, c) : opts.ohoh 
} 

The error message is Cannot read property 'ohoh' of undefined.

It should be fairly clear, that for whatever reason the opts argument is being input as undefined by a function calling the content function.

But because our stack is limited to 10 frames, we can't see what originally called the first iteration of the content function.

One way to address this is to use the --stack-trace-limit flag.

We can see that c defaults to 20, so if we set the limit to 21, maybe we'll see what originally called the c function:

$ node --stack-trace-limit=21 index.js 

This should result in something like the following screenshot:

Now we can see that the original call is made from router.get in the routes.js file, line 6, column 12.

Line 6 is as follows:

res.send(content()) 

Ah... it looks like we're calling content without any inputs; of course, that means the arguments default to undefined.

How it works...

The --stack-trace-limit flag instructs the V8 JavaScript engine to retain more stacks on each tick (each time round) of the event loop.

When an error occurs, a stack trace is generated that traces back through the preceding function calls as far as the defined limit allows.

There's more...

Can we set the stack limit in process? What if we want a different stack trace limit in production versus development environments? We can track and trace asynchronous function calls? Is it possible to have nicer looking stack traces?

Infinite stack trace limit in development

A lot of the time in development we want as much context as we can get, but we don't want to have to type out a long flag every time we run a process.

But in production, we want to save precious resources.

Let's copy the app folder to infinite-stack-in-dev-app:

$ cp -fr app infinite-stack-in-dev-app

Now at very the top of index.js, we simply write the following:

if (process.env.NODE_ENV !== 'production') { 
  Error.stackTraceLimit = Infinity 
} 

Now if we run our server:

$ node index.js

Then, make a request with curl (or, optionally, some other method, such as a browser):

$ curl http://localhost:3000/

Our stack trace will be limitless.

Stack trace layout

The default stack trace could definitely stand to be more human friendly.

Enter cute-stack, a tool for creating prettified stack traces.

Let's copy our app folder to pretty-stack-app and install cute-stack:

$ cp -fr app pretty-stack-app
$ cd app 
$ npm install --save cute-stack

Now let's place the following at the very top of the index.js file:

require('cute-stack')() 

Now let's run our process with a larger stack trace limit (as in the main recipe),

$ node --stack-trace-limit=21 index.js

Make a request, either with a browser, or if installed, curl:

$ curl http://localhost:3000/

As a result, we should see a beautified stack trace, similar to the following screenshot:

Alternative layouts
cute-stack has additional layouts, such as table, tree, and JSON, as well as a plugin system for creating your own layouts see the cute-stack readme for more.

The cute-stack tool takes advantage of a proprietary V8 API, Error.prepareStackTrace, which can be assigned a function that receives error and stack inputs. This function can then process the stack and return a string that becomes the stack trace output.

Error.prepareStackTrace
See https://github.com/v8/v8/wiki/Stack-Trace-API for more on Error.prepareStackTrace.

Asynchronous stack traces

The asynchronous nature of JavaScript affects the way a stack trace works. In JavaScript, each tick (each time the JavaScript event-loop iterates) has a new stack.

Let's copy our app folder to async-stack-app:

$ cp -fr app async-stack-app

Now let's alter content.js like so:

function content (opts, c = 20) { 
  function produce (cb) { 
    if (--c) setTimeout(produce, 10, cb) 
    cb(null, opts.ohoh) 
  } 
  return produce 
} 
 
module.exports = content 

Then let's alter routes.js in the following way:

const content = require('./content') 
const {Router} = require('express') 
const router = new Router() 
 
router.get('/', (req, res) => { 
  content()((err, html) => {  
    if (err) { 
      res.send(500) 
      return 
    }  
    res.send(html) 
  }) 
}) 
 
module.exports = router 

Now we start our server:

$ node index.js

And make a request:

$ curl http://localhost:3000/

We'll see only a small stack trace descending from timeout specific internal code, as in the following screenshot:

We can obtain asynchronous stack traces with the longjohn module. Let's install it as a development dependency:

$ npm install --save-dev longjohn

Now we can add the following the very top of the index.js file:

if (process.env.NODE_ENV !== 'production') { 
  require('longjohn') 
} 

Let's run our server again:

$ node index.js
  

And make a request:

$ curl http://localhost:3000/

Now we should see the original stack, followed by a line of dashes, followed by the call stack of the previous tick.

See also

  • Creating an Express web app, in Chapter 7, Working with Web Frameworks
  • Interfacing with standard I/O, in Chapter 3, Coordinating I/O

Enabling debug logs

More than 13,450 modules directly depend on the third-party debug module (at the time of writing). Many other modules indirectly use the debug module by the use of those 13,450. Some highly notable libraries, such as Express, Koa, and Socket.io, also use the debug module.

In many code bases, there's a wealth of often untapped tracing and debugging logs that we can use to infer and understand how our application is behaving.

In this recipe, we'll discover how to enable and effectively analyze these log messages.

Getting ready

Let's create a small Express app which we'll be debugging.

On the command line, we execute the following commands:

$ mkdir app
$ cd app
$ npm init -y
$ npm install --save express
$ touch index.js

Our index.js file should contain the following:

const express = require('express') 
const app = express() 
const stylus = require('stylus') 
 
app.get('/some.css', (req, res) => { 
  const css = stylus(` 
    body 
      color:black 
  `).render() 
  res.send(css) 
}) 
 
app.listen(3000)
Web frameworks
We're only using Express here as an example, to learn more about Express and other frameworks see Chapter 7, Working With Web Frameworks.

How to do it...

Let's turn on all debug logging:

DEBUG=* node index.js

As soon as we start the server, we see some debug output that should be something like the following screenshot:

The first message is as follows:

express:application set "x-powered-by" to true +0ms

Let's make a mental note to add app.disable('x-powered-by') since it's much better for security to not publicly announce the software a server is using.

Security
For more on security and server hardening, see Chapter 8, Dealing with Security.

This debug log line has helped us to understand how our chosen framework actually behaves, and allows us to mitigate any undesired behaviour in an informed manner.

Now let's make a request to the server. If we have curl installed we can do the following:

$ curl http://localhost:3000/some.css

(Or otherwise, we can simply use a browser to access the same route).

This results in more debug output, mostly a very large amount of stylus debug logs:

While it's interesting to see the Stylus parser at work, it's a little overwhelming. Let's try just looking only at express log output:

$ DEBUG=express:* node index.js

And we'll make a request again (we can use curl or a browser as appropriate):

$ curl http://localhost:3000/some.css

This time our log filtering enabled us to easily see the debug messages for an incoming request.

How it works...

In our recipe, we initially set DEBUG to *, which means enable all logs. Then we wanted to zoom in explicitly on express related log messages. So we set DEBUG to express:*, which means enable all logs that begin with express:. By convention, modules and frameworks delimit sub-namespaces with a : (colon).

At an internal level, the debug module reads from the process.env.DEBUG, splits the string by whitespace or commas, and then converts each item into a regular expression.

When a module uses the debug module, it will require debug and call it with a namespace representing that module to create a logging function that it then uses to output messages when debug logs are enabled for that namespace.

Using the debug module
For more on using the debug module in our own code, see Instrumenting code with debug in the There's more... section.

Each time a module registers itself with the debug module the list of regular expressions (as generated from the DEBUG environment variable) are tested against the namespace provided by the registering module.

If there's no match the resulting logger function is a no-op (that is, an empty function). So the cost of the debug logs in production is minimal.

If there is a match, the returned logging function will accept input, decorate it with ANSI codes (for terminal coloring), and create a time stamp on each call to the logger.

There's more...

Let's find out how to use debug in our own code, and some best practices around enabling debug logs in production scenarios.

Instrumenting code with debug

We can use the debug module in our own code to create logs that relate to the context of our application or module.

Let's copy our app folder from the main recipe, call it instrumented-app, and install the debug module:

$ cp -fr app instrumented-app
$ cd instrumented-app
$ npm install --save debug

Next, we'll make index.js look like so:

const express = require('express') 
const app = express() 
const stylus = require('stylus') 
const debug = require('debug')('my-app') 
 
app.get('/some.css', (req, res) => { 
  debug('css requested') 
  const css = stylus(` 
    body 
      color:black 
  `).render() 
  res.send(css) 
}) 
 
app.listen(3000) 

We've required debug, created a logging function (called debug) with the my-app namespace and then used it in our route handler.

Now let's start our app and just turn on logs for the my-app namespace:

$ DEBUG=my-app node index.js

Now let's make a request to http://localhost:3000/some.css, either in the browser, or with curl we could do the following:

$ curl http://localhost:3000/some.css

This should create the following log message:

my-app css requested +0ms

Using debug in production

The default debug logs are not suited to production logging. The logging output is human-readable rather than machine-readable output; it uses colors that are enabled with terminal ANSI codes (which will essentially pollute the output when saved to file or database).

In production, if we want to turn on debug logs we can produce more standard logging output with the following:

$ DEBUG_COLORS=no DEBUG=* node index.js

JSON logging with pino-debug

The pino-debug module passes debug messages through pino so that log output is in newline-delimited JSON (a common logging format which offers a good compromise between machine and human readability).

About pino
pino is a high performance logger, that's up to 8-9 times faster than other popular loggers (see the benchmarks at: https://github.com/pinojs/pino#benchmarks for more information). For more information about pino visit https://www.npmjs.com/package/pino.

Due to the performant techniques used by pino, using pino-debug leads to a performance increase in log writing (and therefore leaves more room for other in-process activities such as serving requests) even though there's more output per log message!

Let's copy our app folder to logging-app and install pino-debug:

$ cp -fr app logging-app
$ npm install --save pino-debug

We'll add two npm scripts, one for development and one for production. Let's edit package.json like so:

{ 
  "name": "app", 
  "version": "1.0.0", 
  "description": "", 
  "main": "index.js", 
  "scripts": { 
    "test": "echo \"Error: no test specified\" && exit 1", 
    "dev": "node index.js", 
    "prod": "node -r pino-debug index.js" 
  }, 
  "keywords": [], 
  "author": "", 
  "license": "ISC", 
  "dependencies": { 
    "express": "^4.15.0", 
    "pino-debug": "^1.0.3", 
    "stylus": "^0.54.5" 
  } 
} 

Now we run the following:

$ DEBUG=* npm run --silent prod

We should see the express logs in JSON form, where the msg field contains the log contents and the ns field contains the relevant debug message. Additionally, pino adds a few other useful fields, such as time, pid, hostname, level (the log level defaults to 20, which is debug level), and v (the log format version):

Debug namespace to log level mapping
See the pino-debug readme at http://npm.im/pino-debug for mapping namespaces to custom log levels.

See also

  • Creating an Express web app, in Chapter 3, Coordinating I/O
  • Interfacing with standard I/O, in Chapter 3, Coordinating I/O
  • Adding logging, in Chapter 7, Working with Web Frameworks

Enabling core debug logs

It can be highly useful to understand what's going on in Node's core. There's a very easy way to get this information.

In this recipe, we're going to use a special environment variable to enable various debugging flags that cause Node core debug logging mechanisms to print to STDOUT.

Getting ready

We're going to debug a small web server, so let's create that real quick.

On the command line, we execute the following commands:

$ mkdir app
$ cd app
$ npm init -y
$ npm install --save express
$ touch index.js

Our index.js file should contain the following:

const express = require('express') 
const app = express() 
 
app.get('/', (req, res) => res.send('hey')) 
 
setTimeout(function myTimeout() {  
   console.log('I waited for you.') 
}, 100) 
 
app.listen(3000)
Web frameworks
We're only using Express here as an example. To learn more about Express and other frameworks see Chapter 7, Working with Web Frameworks.

How to do it...

We simply have to set the NODE_DEBUG environment variable to one or more of the supported flags.

Let's start with the timer flag by running our app like so:

$ NODE_DEBUG=timer node index.js

This should show something like the following screenshot:

Core timer debug output

Let's try running the process again with both timer and http flags enabled:

$ NODE_DEBUG=timer,http node index.js

Now we need to trigger some HTTP operations to get any meaningful output, so let's send a request to the HTTP server using curl (or an alternative method, such as navigating to http://localhost:3000 in the browser):

$ curl http://localhost:3000

This should give output similar to the following screenshot:

How it works...

The NODE_DEBUG environment variable can be set to any combination of the following flags:

  • http
  • net
  • tls
  • stream
  • module
  • timer
  • cluster
  • child_process
  • fs
The fs debug flag
The quality of output varies for each flag. At the time of writing, the fs flag in particular doesn't actually supply any debug log output, but when enabled will cause a useful stack trace to be added to any unhandled error events for asynchronous I/O calls. See https://github.com/nodejs/node/blob/cccc6d8545c0ebd83f934b9734f5605aaeb000f2/lib/fs.js#L76-L94 for context.

In our recipe, we were able to enable core timer and HTTP debug logs, by setting the NODE_DEBUG environment variable to timers in the first instance and then timers,http in the second.

We used a comma to delimit the debug flags; however, the delimiter can be any character.

Each line of output consists of the namespace, the process ID (PID), and the log message.

When we set NODE_DEBUG to timer, the first log message indicates that it's creating a list for 100. Our code passes 100 as the second argument passed to setTimeout, internally the first argument (the timeout callback) is added to a queue of callbacks that should run after 100 ms. Next, we see a message, timeout callback 100, which means every 100 ms timeout callback will now be called. The following message (the now message) indicates the current time as the internal timers module sees it. This is milliseconds since the timers module was initialized. The now message can be useful to see the time drift between timeouts and intervals, because a timeout of 10 ms will rarely (if ever) be exactly 10 ms. It will be more like 14 ms, because of 4 ms of execution time for other code in a given tick (time around the event loop). While 4 ms drift is acceptable, a 20 ms drift would indicate potential performance problems-a simple NODE_DEBUG=timer prefix could be used for a quick check. The final debug message shows that the 100 list is now empty, meaning all callback functions set for that particular interval have now been called.

Most of the HTTP output is self-explanatory, we can see when a new connection has been made to the server, when a message has ended and when a socket has closed. The remaining two cryptic messages are write ret = true and SERVER socketOnParserExecute 78. The write ret = true relates to when the server attempted to write to a socket. If the value was false, it would mean the socket had closed and (again internally) the server would begin to handle that scenario. As for the socketOnParserExecute message, this has to do with Node's internal HTTP parser (written in C++). The number (78) is the string length of the headers sent from the client to the server.

Combining multiple flags can be useful. We set NODE_DEBUG to timer,http and we were able to see how the http module interacts with the internal timer module. We can see after the SERVER new http connection message; that two timers are set (based on the timeout lists being created), one for 12,0000 ms (two minutes, the default socket timeout) and one (in the example case) for 819 ms.

This second interval (819) is to do with an internal caching mechanism for the HTTP Date header. Since the smallest unit in the Date header is seconds, a timeout is set for the amount of milliseconds remaining before the next second, and the Date header is provided the same string for the remainder of that second.

Core mechanics
For a deeper understanding of our discussion here, see the There's more... section where we use debugging tools to step through code in Node core to show how to fully pick apart the log messages in this recipe.

There's more...

Let's look at the way Node Core triggers the debug log messages, and see if we can use this knowledge to gain a greater understanding of Node's internal workings.

Creating our own NODE_DEBUG flags

Core modules tend to use the util module's debuglog method to generate a logging function that defaults to a no-op (an empty function) but writes log messages to STDOUT when the relevant flag appears in the NODE_DEBUG environment variable.

We can use util.debuglog to create our own core like log messages.

Let's take the app folder we created in the main recipe and copy it to instrumented-app:

$ cp -fr app instrumented-app

Now let's make index.js look like this:

const util = require('util') 
const express = require('express') 
const debug = util.debuglog('my-app') 
const app = express() 
 
app.get('/', (req, res) => { 
  debug('incoming request on /', req.route) 
  res.send('hey') 
}) 
 
setTimeout(function myTimeout() {  
   debug('timeout complete') 
   console.log('I waited for you.') 
}, 100) 
 
app.listen(3000) 

Now we can turn on our custom debug logs like so:

$  NODE_DEBUG=my-app node index.js

If we make a request to http://localhost:3000, the output of our process should look something like this:

MY-APP 30843: timeout complete 
I waited for you. 
MY-APP 30843: incoming request on / Route { 
  path: '/', 
  stack: 
   [ Layer { 
       handle: [Function], 
       name: '<anonymous>', 
       params: undefined, 
       path: undefined, 
       keys: [], 
       regexp: /^\/?$/i, 
       method: 'get' } ], 
  methods: { get: true } } 
Prefer the debug module
In many cases, using the third-party debug module instead of util.debuglog is preferable. The debug modules supports wildcards, and the output is time stamped and color-coded, while the production cost of using it is negligible. See the Enabling debug logs recipe in this chapter for more.

Debugging Node core libraries

The core libraries that come bundled with the Node binary are written in JavaScript, which means we can debug them the same way we debug our own code. This level of introspection means we can understand internal mechanics to a fine level of detail.

Let's use Devtools to pick apart how util.debuglog works.

Devtools
To understand how to use Devtools, see the first recipe in this chapter, Debugging Node with Chrome Devtools.

We'll run our code we prepared in the Getting ready section like so (Node 8+):

$ NODE_DEBUG=timer node --inspect-brk index.js

Or if we're using Node 6.3.0+, use the following:

$ NODE_DEBUG=timer node --debug-brk --inspect index.js

Now if we navigate to chrome://inspect, click the inspect link this will open Devtools for our Node process. We should then see something like the following:

Now in left hand pane (the Navigation pane), we should see two drop-down trees (no domain) and file://. The (no domain) files are files that came compiled into Node.

Let's click the small right-facing triangle next to (no domain) to expand the list. Then locate the util.js file and double-click to open. At this point, we should see something like the following:

Next, we want to find the debuglog function. An easy way to do this is to press Cmd + F on macOS or Ctrl + F on Linux and Windows, to bring up the small find dialog, then type debuglog. This should highlight the exported debuglog method:

If we read the exported function, we should be able to ascertain that given the right conditions (for example, if the flag is set on NODE_DEBUG), a function is created and associated to a namespace. Different Node versions could have differences in their util.js. In our case, the first line of this generated function is line 157, so we set a breakpoint on line 157 (or wherever the first line of the generated function may be):

Now if we press run, our breakpoint should be triggered almost immediately. Let's hover over the arguments object referenced in the generated function:

We should see that the second argument passed to the generated debug function is 100 this relates to the millisecond parameter we pass to setTimeout in our index.js and is part of the first debug message (no 100 list was found...).

Now let's hit the blue play button four more times until it changes to a pause button and the top-right corner shows an error count of 4 as shown in the following screenshot:

Devtools perceives each log message as an error because the debug messages are written to STDERR. This is why the error count in the top-right corner is 4.

Now let's open a new browser tab and navigate to http://localhost:3000.

Devtools should have paused again at our breakpoint. If we hover over the arguments object in the generated function we should see that the second argument is 12000. This relates to the default 2 minute timeout on sockets (as discussed in the main recipe):

If we hit the play button again and inspect the arguments object, we should see the second argument is a number that's less than 1000:

Over on the right-hand side, in the Call Stack panel there's a frame called utcDate. Let's select that frame to view the function:

This function is in a library that's only for internal core use called _http_outgoing.js.

We can see that it's currently within an if block that checks whether dateCache is falsey. If dateCache is falsey, it creates a new Date object and assigns the output of toUTCString to dateCache. Then it uses timers.enroll. This is a way of creating a setTimeout where the provided object represents the timeout reference. It sets the time to 1000 minus the millisecond unit in the date object that effectively measures how long there is left of the current second. Then it calls timers._unrefActive, which activates the timer without allowing the timer to keep the event loop open (which means the fact the queued timer operation won't keep the process alive). The utcDate._onTimeout method sets dateCache to undefined, so at the end of the timeout, dateCache is cleared.

If we look down the Call Stack panel, we should be able to infer that the utcDate function is called when a request is made, and is to do with HTTP header generation (specifically the Date HTTP header).

The net effect is that a process may receive, say, 10,000 requests a second, and only the first of those 10,000 has to perform the relatively expensive Date generation, while the following 9,999 requests all use the cached date.

And that's the sort of thing we can discover by debugging core.

See also

  • Creating an Express web app, in Chapter 7, Working with Web Frameworks
  • Working with files, in Chapter 3, Coordinating I/O
  • Communicating over sockets, in Chapter 3, Coordinating I/O
Left arrow icon Right arrow icon
Download code icon Download Code

Key benefits

  • Actionable recipes across the full spectrum of Node.js development
  • Cutting edge techniques and tools for measuring and improving performance
  • Best practices for creating readily-scalable production systems

Description

Today's web demands efficient real-time applications and scalability. Asynchronous event-driven programming is ideal for this, and this is where Node.js comes in. Server-side JavaScript has been here since the 90s, but Node got it right. With Node for tooling and server-side logic, and a browser-based client-side UI, everything is JavaScript. This leads to rapid, fluid development cycles. The full-stack, single language experience means less context-switching between languages for developers, architects and whole teams. This book shows you how to build fast, efficient, and scalable client-server solutions using the latest versions of Node. The book begins with debugging tips and tricks of the trade, and how to write your own modules. Then you'll learn the fundamentals of streams in Node.js, discover I/O control, and how to implement the different web protocols. You'll find recipes for integrating databases such as MongoDB, MySQL/MariaDB, Postgres, Redis, and LevelDB. We also cover the options for building web application with Express, Hapi and Koa. You will then learn about security essentials in Node.js and advanced optimization tools and techniques. By the end of the book you will have acquired the level of expertise to build production-ready and scalable Node.js systems. The techniques and skills you will learn in this book are based on the best practices developed by nearForm, one of the leaders in Node implementations, who supported the work of the authors on this book.

Who is this book for?

If you have good knowledge of JavaScript and want to build fast, efficient, scalable client-server solutions, then this book is for you. Some experience with Node.js is assumed to get the most out of this book. If working from a beginner level Node Cookbook 2nd Edition is recommended as a primer for Node Cookbook 3rd Edition.

What you will learn

  • Debug Node.js programs
  • Write and publish your own Node.js modules
  • Detailed coverage of Node.js core API's
  • Use web frameworks such as Express, Hapi and Koa for accelerated web application development
  • Apply Node.js streams for low-footprint data processing
  • Fast-track performance knowledge and optimization abilities
  • Persistence strategies, including database integrations with MongoDB, MySQL/MariaDB, Postgres, Redis, and LevelDB
  • Apply critical, essential security concepts
  • Use Node with best-of-breed deployment technologies: Docker, Kubernetes and AWS
Estimated delivery fee Deliver to Greece

Premium delivery 7 - 10 business days

€17.95
(Includes tracking information)

Product Details

Country selected
Publication date, Length, Edition, Language, ISBN-13
Publication date : Jul 31, 2017
Length: 656 pages
Edition : 3rd
Language : English
ISBN-13 : 9781785880087
Languages :
Tools :

What do you get with Print?

Product feature icon Instant access to your digital eBook copy whilst your Print order is Shipped
Product feature icon Paperback book shipped to your preferred address
Product feature icon Download this book in EPUB and PDF formats
Product feature icon Access this title in our online reader with advanced features
Product feature icon DRM FREE - Read whenever, wherever and however you want
OR
Modal Close icon
Payment Processing...
tick Completed

Shipping Address

Billing Address

Shipping Methods
Estimated delivery fee Deliver to Greece

Premium delivery 7 - 10 business days

€17.95
(Includes tracking information)

Product Details

Publication date : Jul 31, 2017
Length: 656 pages
Edition : 3rd
Language : English
ISBN-13 : 9781785880087
Languages :
Tools :

Packt Subscriptions

See our plans and pricing
Modal Close icon
€18.99 billed monthly
Feature tick icon Unlimited access to Packt's library of 7,000+ practical books and videos
Feature tick icon Constantly refreshed with 50+ new titles a month
Feature tick icon Exclusive Early access to books as they're written
Feature tick icon Solve problems while you work with advanced search and reference features
Feature tick icon Offline reading on the mobile app
Feature tick icon Simple pricing, no contract
€189.99 billed annually
Feature tick icon Unlimited access to Packt's library of 7,000+ practical books and videos
Feature tick icon Constantly refreshed with 50+ new titles a month
Feature tick icon Exclusive Early access to books as they're written
Feature tick icon Solve problems while you work with advanced search and reference features
Feature tick icon Offline reading on the mobile app
Feature tick icon Choose a DRM-free eBook or Video every month to keep
Feature tick icon PLUS own as many other DRM-free eBooks or Videos as you like for just €5 each
Feature tick icon Exclusive print discounts
€264.99 billed in 18 months
Feature tick icon Unlimited access to Packt's library of 7,000+ practical books and videos
Feature tick icon Constantly refreshed with 50+ new titles a month
Feature tick icon Exclusive Early access to books as they're written
Feature tick icon Solve problems while you work with advanced search and reference features
Feature tick icon Offline reading on the mobile app
Feature tick icon Choose a DRM-free eBook or Video every month to keep
Feature tick icon PLUS own as many other DRM-free eBooks or Videos as you like for just €5 each
Feature tick icon Exclusive print discounts

Frequently bought together


Stars icon
Total 116.97
Node Cookbook
€41.99
Mastering  Node.js
€41.99
Learning Node.js Development
€32.99
Total 116.97 Stars icon
Banner background image

Table of Contents

11 Chapters
Debugging process* Chevron down icon Chevron up icon
Writing Modules Chevron down icon Chevron up icon
Coordinating I/O Chevron down icon Chevron up icon
Using Streams Chevron down icon Chevron up icon
Wielding Web Protocols Chevron down icon Chevron up icon
Persisting to Databases Chevron down icon Chevron up icon
Working with Web Frameworks Chevron down icon Chevron up icon
Dealing with Security Chevron down icon Chevron up icon
Optimizing Performance Chevron down icon Chevron up icon
Building Microservice Systems Chevron down icon Chevron up icon
Deploying Node.js Chevron down icon Chevron up icon

Customer reviews

Rating distribution
Full star icon Full star icon Full star icon Full star icon Half star icon 4.7
(3 Ratings)
5 star 66.7%
4 star 33.3%
3 star 0%
2 star 0%
1 star 0%
Phil Aug 08, 2018
Full star icon Full star icon Full star icon Full star icon Full star icon 5
Reading through on Mac Kindle Reader, content is accessible, structure is clear and straightforward.. wish I'd bought it sooner, thanks!
Amazon Verified review Amazon
Tessarolo Tommaso Sep 02, 2018
Full star icon Full star icon Full star icon Full star icon Full star icon 5
Per chi vuole approfondire differenti tecniche di programmazione di Node.js questo libro è un must. Si parte dal debugging, passando per l'ottimizzazione, la gestione degli stream e quindi alla descrizione di un approccio "manuale" per la costruzione di un sistema a microservices, arrivando al deploy in produzione. Ben scritto, semplice da capire, con molti spunti e tanto codice da studiare.
Amazon Verified review Amazon
SLS Feb 17, 2018
Full star icon Full star icon Full star icon Full star icon Empty star icon 4
Really good material if you need to check how to do something. If you are knowledgeable in express and want to try out koa, the book will help with things like that. While not a book I or anyone should read front to back, still a great reference book.
Amazon Verified review Amazon
Get free access to Packt library with over 7500+ books and video courses for 7 days!
Start Free Trial

FAQs

What is the delivery time and cost of print book? Chevron down icon Chevron up icon

Shipping Details

USA:

'

Economy: Delivery to most addresses in the US within 10-15 business days

Premium: Trackable Delivery to most addresses in the US within 3-8 business days

UK:

Economy: Delivery to most addresses in the U.K. within 7-9 business days.
Shipments are not trackable

Premium: Trackable delivery to most addresses in the U.K. within 3-4 business days!
Add one extra business day for deliveries to Northern Ireland and Scottish Highlands and islands

EU:

Premium: Trackable delivery to most EU destinations within 4-9 business days.

Australia:

Economy: Can deliver to P. O. Boxes and private residences.
Trackable service with delivery to addresses in Australia only.
Delivery time ranges from 7-9 business days for VIC and 8-10 business days for Interstate metro
Delivery time is up to 15 business days for remote areas of WA, NT & QLD.

Premium: Delivery to addresses in Australia only
Trackable delivery to most P. O. Boxes and private residences in Australia within 4-5 days based on the distance to a destination following dispatch.

India:

Premium: Delivery to most Indian addresses within 5-6 business days

Rest of the World:

Premium: Countries in the American continent: Trackable delivery to most countries within 4-7 business days

Asia:

Premium: Delivery to most Asian addresses within 5-9 business days

Disclaimer:
All orders received before 5 PM U.K time would start printing from the next business day. So the estimated delivery times start from the next day as well. Orders received after 5 PM U.K time (in our internal systems) on a business day or anytime on the weekend will begin printing the second to next business day. For example, an order placed at 11 AM today will begin printing tomorrow, whereas an order placed at 9 PM tonight will begin printing the day after tomorrow.


Unfortunately, due to several restrictions, we are unable to ship to the following countries:

  1. Afghanistan
  2. American Samoa
  3. Belarus
  4. Brunei Darussalam
  5. Central African Republic
  6. The Democratic Republic of Congo
  7. Eritrea
  8. Guinea-bissau
  9. Iran
  10. Lebanon
  11. Libiya Arab Jamahriya
  12. Somalia
  13. Sudan
  14. Russian Federation
  15. Syrian Arab Republic
  16. Ukraine
  17. Venezuela
What is custom duty/charge? Chevron down icon Chevron up icon

Customs duty are charges levied on goods when they cross international borders. It is a tax that is imposed on imported goods. These duties are charged by special authorities and bodies created by local governments and are meant to protect local industries, economies, and businesses.

Do I have to pay customs charges for the print book order? Chevron down icon Chevron up icon

The orders shipped to the countries that are listed under EU27 will not bear custom charges. They are paid by Packt as part of the order.

List of EU27 countries: www.gov.uk/eu-eea:

A custom duty or localized taxes may be applicable on the shipment and would be charged by the recipient country outside of the EU27 which should be paid by the customer and these duties are not included in the shipping charges been charged on the order.

How do I know my custom duty charges? Chevron down icon Chevron up icon

The amount of duty payable varies greatly depending on the imported goods, the country of origin and several other factors like the total invoice amount or dimensions like weight, and other such criteria applicable in your country.

For example:

  • If you live in Mexico, and the declared value of your ordered items is over $ 50, for you to receive a package, you will have to pay additional import tax of 19% which will be $ 9.50 to the courier service.
  • Whereas if you live in Turkey, and the declared value of your ordered items is over € 22, for you to receive a package, you will have to pay additional import tax of 18% which will be € 3.96 to the courier service.
How can I cancel my order? Chevron down icon Chevron up icon

Cancellation Policy for Published Printed Books:

You can cancel any order within 1 hour of placing the order. Simply contact customercare@packt.com with your order details or payment transaction id. If your order has already started the shipment process, we will do our best to stop it. However, if it is already on the way to you then when you receive it, you can contact us at customercare@packt.com using the returns and refund process.

Please understand that Packt Publishing cannot provide refunds or cancel any order except for the cases described in our Return Policy (i.e. Packt Publishing agrees to replace your printed book because it arrives damaged or material defect in book), Packt Publishing will not accept returns.

What is your returns and refunds policy? Chevron down icon Chevron up icon

Return Policy:

We want you to be happy with your purchase from Packtpub.com. We will not hassle you with returning print books to us. If the print book you receive from us is incorrect, damaged, doesn't work or is unacceptably late, please contact Customer Relations Team on customercare@packt.com with the order number and issue details as explained below:

  1. If you ordered (eBook, Video or Print Book) incorrectly or accidentally, please contact Customer Relations Team on customercare@packt.com within one hour of placing the order and we will replace/refund you the item cost.
  2. Sadly, if your eBook or Video file is faulty or a fault occurs during the eBook or Video being made available to you, i.e. during download then you should contact Customer Relations Team within 14 days of purchase on customercare@packt.com who will be able to resolve this issue for you.
  3. You will have a choice of replacement or refund of the problem items.(damaged, defective or incorrect)
  4. Once Customer Care Team confirms that you will be refunded, you should receive the refund within 10 to 12 working days.
  5. If you are only requesting a refund of one book from a multiple order, then we will refund you the appropriate single item.
  6. Where the items were shipped under a free shipping offer, there will be no shipping costs to refund.

On the off chance your printed book arrives damaged, with book material defect, contact our Customer Relation Team on customercare@packt.com within 14 days of receipt of the book with appropriate evidence of damage and we will work with you to secure a replacement copy, if necessary. Please note that each printed book you order from us is individually made by Packt's professional book-printing partner which is on a print-on-demand basis.

What tax is charged? Chevron down icon Chevron up icon

Currently, no tax is charged on the purchase of any print book (subject to change based on the laws and regulations). A localized VAT fee is charged only to our European and UK customers on eBooks, Video and subscriptions that they buy. GST is charged to Indian customers for eBooks and video purchases.

What payment methods can I use? Chevron down icon Chevron up icon

You can pay with the following card types:

  1. Visa Debit
  2. Visa Credit
  3. MasterCard
  4. PayPal
What is the delivery time and cost of print books? Chevron down icon Chevron up icon

Shipping Details

USA:

'

Economy: Delivery to most addresses in the US within 10-15 business days

Premium: Trackable Delivery to most addresses in the US within 3-8 business days

UK:

Economy: Delivery to most addresses in the U.K. within 7-9 business days.
Shipments are not trackable

Premium: Trackable delivery to most addresses in the U.K. within 3-4 business days!
Add one extra business day for deliveries to Northern Ireland and Scottish Highlands and islands

EU:

Premium: Trackable delivery to most EU destinations within 4-9 business days.

Australia:

Economy: Can deliver to P. O. Boxes and private residences.
Trackable service with delivery to addresses in Australia only.
Delivery time ranges from 7-9 business days for VIC and 8-10 business days for Interstate metro
Delivery time is up to 15 business days for remote areas of WA, NT & QLD.

Premium: Delivery to addresses in Australia only
Trackable delivery to most P. O. Boxes and private residences in Australia within 4-5 days based on the distance to a destination following dispatch.

India:

Premium: Delivery to most Indian addresses within 5-6 business days

Rest of the World:

Premium: Countries in the American continent: Trackable delivery to most countries within 4-7 business days

Asia:

Premium: Delivery to most Asian addresses within 5-9 business days

Disclaimer:
All orders received before 5 PM U.K time would start printing from the next business day. So the estimated delivery times start from the next day as well. Orders received after 5 PM U.K time (in our internal systems) on a business day or anytime on the weekend will begin printing the second to next business day. For example, an order placed at 11 AM today will begin printing tomorrow, whereas an order placed at 9 PM tonight will begin printing the day after tomorrow.


Unfortunately, due to several restrictions, we are unable to ship to the following countries:

  1. Afghanistan
  2. American Samoa
  3. Belarus
  4. Brunei Darussalam
  5. Central African Republic
  6. The Democratic Republic of Congo
  7. Eritrea
  8. Guinea-bissau
  9. Iran
  10. Lebanon
  11. Libiya Arab Jamahriya
  12. Somalia
  13. Sudan
  14. Russian Federation
  15. Syrian Arab Republic
  16. Ukraine
  17. Venezuela