A recommended toolkit
There are a number of common utilities needed to investigate network and public key infrastructure (PKI) issues. The samples within this book will be from a variety of operating systems. The server will be on FreeBSD 10.2, and we will show macOS X and Windows 7 and 10.
The majority of diagnostics will be done at the server side of the connection, but there are useful things to glean from client-side utilities. The tools listed here will be demonstrated, but this book isn't a manual for their use. For full documentation, refer to the documentation links provided.
Note
Both the FreeBSD project and GNU have web interfaces for browsing man pages. The main page for these can be found at the following paths:
Log search and filtering
Detailed logging is available from OpenVPN on both the client and server sides, which allows configuration issues to be identified quickly. Having the ability to search these logs for the pertinent information is vital to successfully correcting problems and verifying a functional service. The utilities identified here will aid in these search tasks.
grep
The grep utility is likely to be one of the first utilities learned by an aspiring Unix user. Finding strings or keywords within a file or a set of files quickly is the first step in tracking down entries in a log file or a configuration directive. grep allows you to search and highlight specific lines, context around those lines, filenames, line numbers, and more. In addition to finding lines of text, grep can also omit lines you do not want to see.
The #openvpn support channel on Freenode (irc.freenode.net) IRC as well as on the OpenVPN forum (http://forums.openvpn.net), for example, request that users seeking support omit comments and empty lines with the following command:
grep -vE '^#|^;|^$' server.conf
Take a sample config file:
ecrist@meow:~-> cat foo.conf
# this is a comment
; this is also a comment


    # the line above is empty


    config argument


    ; another comment
If we pipe that through our grep filter:
ecrist@meow:~-> grep -vE '^#|^;|^$' foo.conf
config argument
less, more, and most
Paging applications are a common feature of Unix and Unix-like operating systems. These tools allow the user to view a large amount of content, typically text, to be viewed one page at a time. In general, there are three such common tools, less, more, and most.
The more utility is the most ubiquitous of the three, being installed by default on every Unix, Linux, or other similar system I have used for the past 20 years. Being the first paging utility, the more utility's general functionality is limited. When output from a file or pipe contained more content than what could be displayed on a single screen, the content would be paged.
Scrolling down through the content was possible either a line at a time, using a down arrow key press, or a full page/window at a time with a press of the spacebar. Scrolling back up was not supported:

In 1983, Mark Nudelman authored the less utility specifically for backward scroll capability. It was released in May, 1985, via the newsgroup net.sources. Many features have been added to less, including pattern match highlighting and vi-like movement through the stream. To date, there have been over 450 released updates.
Modern Unix and Linux systems typically ship just the less utility now, with more being a hard-link to the less binary. When executed this way, less operates in a compatibility mode similar to more. This behavior can also be evoked by setting the environment variable LESS_IS_MORE.
The final pager of note is most, which operates similar to less, but adds the capability for multiple windows within a single terminal session. The most pager also appears to support color escape sequences better than less. The following screenshot shows most displaying two windows, one with the less man page and the other with the most man page:

There are packages for most available for FreeBSD, macOS X, and Linux, but the latest release of most was in 2007, and the development seems to have stalled entirely. The windowed features can be replaced with other tools such as tmux and screen, which fall outside the scope of this book.
Note
Project pages for the less and most utilities can be found at the following paths:
Regular expressions
Regular expression (regex) is a syntax that can be leveraged with string or pattern matching. There are already troves of other books and online guides about constructing quality regular expressions, but some basic syntax here will get you started in your troubleshooting endeavors.
This book will primarily use regular expressions in conjunction with the grep utility described earlier. Coupling regex with grep will allow us to specifically grab or omit lines from a log file. This is particularly useful when looking for specific client errors, or omitting a slew of noisy log entries from the view.
Regular expressions are composed of a sequence of pattern matching characters and character classes. Character classes are simply groups of characters or character types.
Some syntax characters to note are as follows:
|
Character |
Example |
Description and use |
|
|
^foo
Line must start with
[^ab]
Excludes
|
Denotes the start of the line. Inside a character class, denotes character exclusion. |
|
|
foo$
Line must end with
|
Denotes the end of the line. |
|
|
Hello\.
Line contains
|
Signifies the following character should be interpreted literally. To match a |
|
|
(foobar)
Groups
|
Start and end of a group. |
|
|
[0-9a-f]
Matches characters
|
Start and end of a character class. |
|
|
[\da-f]
Matches characters
|
Matches numeric characters. Same as |
|
|
^\d\w
Matches
|
Matches alphanumeric characters including digits, letters, and the underscore. Same as |
|
|
[\w\s]
Matches any word, character, or space character one time.
|
Matches space and tab, respectively. |
|
|
foobar.
Matches
|
A period matches any character. |
|
|
[0-9a-f]{1,9}
Characters
[\d]{3}
Any digit must appear exactly three times, does not have to be the same digit.
|
Specifies the minimum and maximum of the previous character or group. When only a single quantity is defined, indicates an exact count. |
|
|
(foobar)?
|
The previous character or group may or may not appear. |
|
|
\w+
Matches any word character one or more times.
|
Indicates the previous item (group, character class, or character) must appear at least once, or more. |
|
|
(ab)|(bc)
Both
|
A separator, like a logical |
There are a few online tools that can be used to validate and test your regular expression syntax. This is a good idea as they will demonstrate, graphically, how the changes to your pattern affect what is matched within a string or series of strings. Some of the online tools available online are as follows:
- Regex Pal: http://www.regexpal.com
- Regexr: http://regexr.com
For additional reading, I strongly suggest the book commonly referred to as the camel book Programming Perl, 4th Edition, by Larry Wall. When I am stumped or need to understand how a regular expression is functioning, I find it an invaluable resource and a common reference.
Note
You can also find tutorials and reading by navigating to http://www.regular-expressions.info.
Network sniffing and analysis
There will be times when log files and OpenVPN output alone are not enough to identify a problem. It is possible that the issue resides outside of the OpenVPN process or the configuration therein. This could mean that there is a protocol error for some program being encapsulated within the tunnel or there is some upstream issue not readily apparent.
The tools listed here will provide an insight to the protocols and environment around and consuming your OpenVPN setup.
tcpdump
The ultimate command-line network diagnostic tool is the venerable tcpdump. tcpdump is used to capture network traffic on an interface, and it provides an interface to filter-specific traffic, including unique destination addresses, ports, packet types, protocols, and more. This tool can be used at a very low level to determine maximum transmission unit (MTU) issues, protocol issues, and many others.
Depending on your level of networking experience, this tool may or may not be directly useful, but packet captures can be sent to more experienced people.
Tip
Do not rule this tool out even if you do not fully understand it yourself.
The following screenshot shows a simple single ping from a test host to Google's 8.8.8.8 DNS resolver IP. We had to use sudo as the packet capture requires root privileges on the network interface. Our first command line included option -A, which specifies ASCII output and is the unintelligible at the end of each packet info line. The second example shows the same ping without the -A option (same screenshot):

A much more detailed introduction to tcpdump is available by going to Daniel Miessler's blog at https://danielmiessler.com/study/tcpdump/.
traceroute
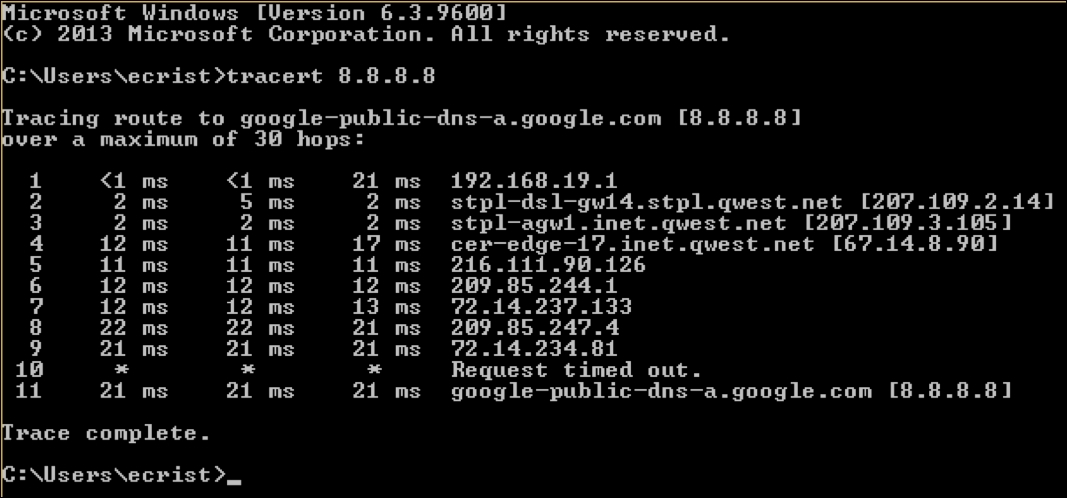
On Linux, BSD, and macOS X, traceroute, or on Windows tracert, knowing the path to assorted destinations is a crucial tool. You can quickly ascertain whether traffic is departing the default gateway or a VPN connection. As a bonus, response time to each hop along the path is calculated, which may indicate slow points along the route.
Contrary to the popular belief, these commands are not for hacking or seeing how many people are using a website; you will not improve your K/D ratio in Call of Duty®. These are legitimate network diagnostic tools.
Note
Check out the YouTube video by NextGenHacker101 for a quick laugh at https://www.youtube.com/watch?v=SXmv8quf_xM.
For a quick change of pace, here is a screenshot of the tracert command from Windows 8. From the output, we can see that there are eight hops between my test Windows 8 system and Google's resolver:
mtr
My traceroute or mtr is a utility that combines the functionality of ping and traceroute. This tool can help illustrate where along a network path latency or packet loss occurs. I still prefer to use ping and traceroute individually at times, but use mtr to quickly identify network connectivity issues.
Both tcpdump and tracert will stop, by default, after the last hop or a maximum of 30 has been reached. mtr, on the other hand, will continue cycling until quit with a Ctrl + C. ping on *nix system functions in a similar manner of pinging indefinitely.
Here is a sample output from mtr between my test system and the Google website:
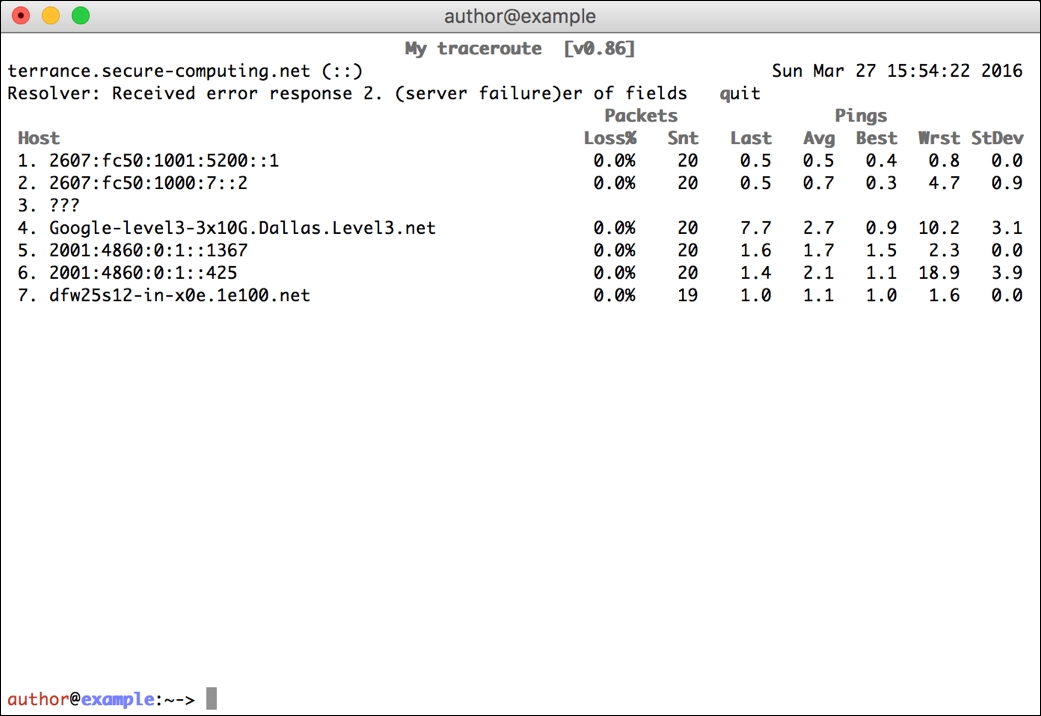
Notice the Snt column and that all list 20 apart from hop seven. I pressed Ctrl + C just as the cycle hit hop seven, so the twentieth packet was never sent.
ping
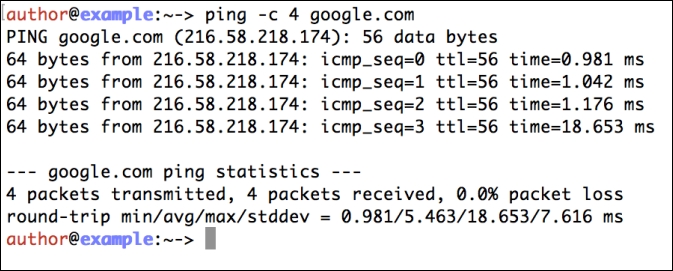
Good ol' ping. This is usually the first tool in the network troubleshooter's toolbox. This is generally the quickest way to determine if a remote system is alive or not. This tool is very much cross-platform, and it is available on Linux, Unix, and Windows systems by default. Only the most hostile or ill-managed corporate networks block this. The following screenshot shows an example of ping:
Wireshark
Coupled with the tcpdump utility, and sometimes on its own, Wireshark is arguably the most powerful tool in our network troubleshooting toolbox. This tool provides a relatively easy-to-use graphical interface to navigate packet captures. In addition, it provides a filtering interface that allows you to isolate specific streams, protocols, and destinations.
One particular trick Wireshark can do is to decrypt TLS and SSL traffic, given the private and public keys of a web server or server/client pair. This is analogous to the features of the latest next-generation firewalls that do decryption at the border for corporate networks.
The following screenshot shows a short eight-packet transaction for a short IPv6 ping:
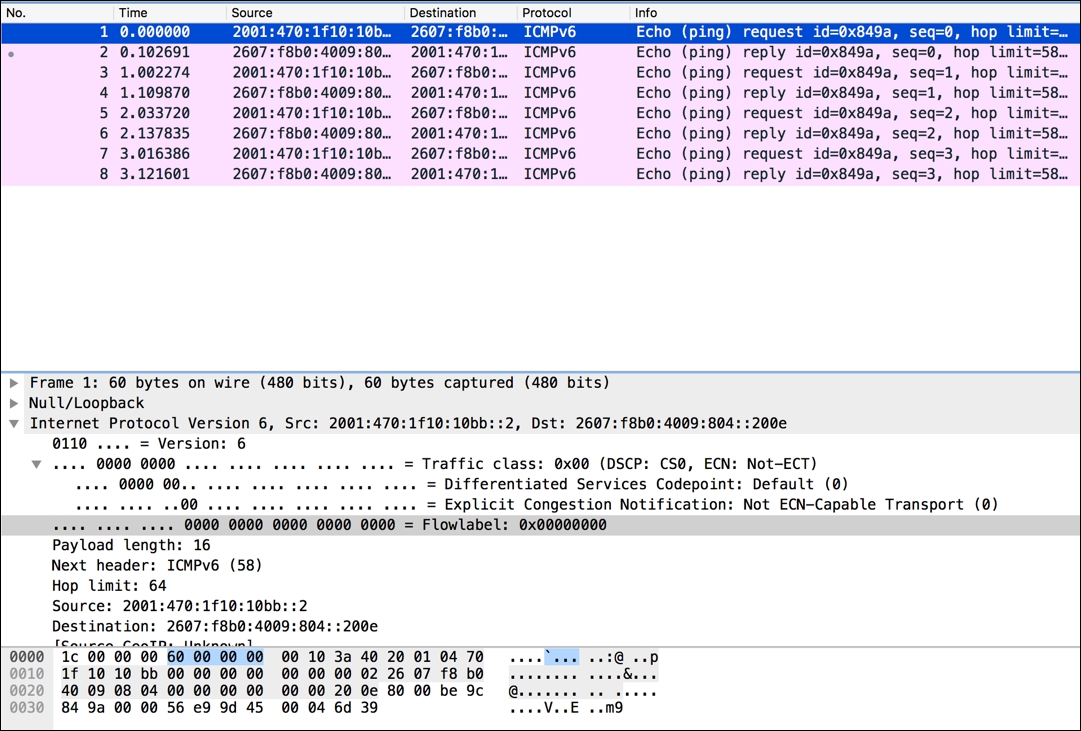
In my experience in the scope of OpenVPN, Wireshark is primarily used along side tcpdump. Many OpenVPN servers and clients will have tcpdump readily available, already installed, or easily installed when needed. Wireshark requires X11 or other graphical tools and libraries that may not be as easy to install.
It is easy to take a packet capture using tcpdump, save the capture to a file (see the -w option for tcpdump), and transfer that capture to a system with Wireshark installed. The observant reader may have noted the window title in the earlier screenshot: the packet capture here is actually being read-in from a file.
X.509 verification and inspection
Cryptography and PKI are often difficult to understand and much more difficult to resolve issues with. There are primarily two utilities, OpenSSL and Wireshark, that can aid with peering into the cryptographic components of OpenVPN.
Note
OpenVPN also supports PolarSSL (recently known as ARM® mbed™) as a replacement for OpenSSL. The latest package, 2.2.1, includes some rudimentary programs for certification creation, but it does not include s_client and other utilities included with OpenSSL. More information can be found on their website at http://tls.mbed.org.
OpenSSL
OpenSSL is the ubiquitous library for X.509 certificate PKI. OpenVPN has supported the use of X.509 certificates for TLS connections since before 2002. The OpenSSL command-line utilities allow certificate chain verification, outputting certificate details for inspection, build Diffie-Hellman parameters, and even substantiating an SSL/TLS server or client instance.
I have used the s_client subcommand to fetch the full SSL certification chain for the Google website. All three certificates are listed: the GeoTrust CA root certificate, the Google Intermediate CA (they get to sign their own certificates), and the server certificate their intermediate CA issued. See the following code:
author@example:~-> openssl s_client -showcerts -connect openvpn.net:443
With this command, I manually copied each certificate block and saved them to individual files, GoogleSrv.crt (certificate 0), GoogleCA.crt (certificate 1), and GeoTrustCA.crt (certificate 2).
A certificate block looks like the following:
-----BEGIN CERTIFICATE-----
MIIDfTCCAuagAwIBAgIDErvmMA0GCSqGSIb3DQEBBQUAME4xCzAJBgNVBAYTAlVT
[snip]
NhGc6Ehmo21/uBPUR/6LWlxz/K7ZGzIZOKuXNBSqltLroxwUCEm2u+WR74M26x1W
b8ravHNjkOR/ez4iyz0H7V84dJzjA1BOoa+Y7mHyhD8S
-----END CERTIFICATE-----
Wireshark
Wireshark was discussed previously, but this is where that utility will demonstrate its capability. In addition to the ability to decode and illustrate various (nearly all) protocol streams, given the private and public keys available to a VPN admin, it can decipher SSL and TLS encrypted streams, including OpenVPN streams.
To demonstrate the ability to decrypt a TLS session, we will use the OpenSSL s_server command to create a generic HTTPS server. I have created a very simple web page that simply reads, This content is encrypted. I used the following command to create the server. Note that to start the daemon on port 443, you need to use root or sudo. To avoid escalating privileges, you can use a port 1024, such as 4443.
To begin, create a certificate/key pair:
author@example:~-> openssl req -x509 -newkey rsa:2048 -keyout
    key.pem -out cert.pem -days 365 -nodes
Then, we start our server:
author@example:~-> sudo openssl s_server -key key.pem -cert
    cert.pem -WWW -accept 443
The s_server process will use the current working directory for its web root, so I placed our web content there as index.html.
Tip
The preceding command used sudo because it opened a listening port on a privileged port. All TCP/UDP ports numbered 1024 and lower are considered privileged, and they require root or administrator permissions to open.
Now, I will start Wireshark and set it to capture traffic on the loopback interface. Because we are going to connect to the localhost address (127.0.0.1 or ::1), the traffic will use this interface. If we connect to the actual system IP address, then capture traffic on the real interface.
Now, open a web browser to the system. In my case, this is the local machine. The URL I will use https://localhost/index.html, if you changed the port, add it to the URL such as https://localhost:4443/index.html.
If all the steps mentioned earlier were performed correctly, you should have a browser window with a simple message and a Wireshark window with approximately 25 packets captured:

In the packet capture, you will see some protocol data that is indicative of what is happening. We will touch on the protocol exchanges later, but you can clearly see the TLS handshake and cipher exchange taking place:

The lines in the capture have a black background, indicating the transmission carried encrypted payload data. Next, we will take the certificate and the key we created earlier and import those into Wireshark. This will allow us to view the transaction.
Before we do that, we will examine packets 17 and 19. Both of these are labeled with the generic phrase Application Data and contain our actual HTML. These packets are encrypted, and they examine them by clicking on them.
By going to Preferences | Protocols | SSL, Wireshark provides a way to import the TLS key we created earlier. On macOS X, the dialog resembles the following screenshot. You can specify the port here, but it is optional. In my case, I simply listed the IP 127.0.0.1 and the key file:

If we go back and inspect our packets now, we can see a new tab in the payload pane. The first is labeled Frame, and the second is Decrypted SSL data:

Click on the second tab for packet 19, and we can actually see the decrypted page content:
<html>
    <head>
        <title>
            Hello!
        </title>
    </head>
    <body>
        <p>This content is encrypted.</p>
    </body>
</html>
Note
The ability to decrypt the OpenVPN TLS streams is significant enough that the Wireshark wiki itself has a page specifically demonstrating this capability: https://wiki.wireshark.org/OpenVPN.


