Development environments for Python scripting
In this section, we will review PyCharm and Python IDLE as development environments for Python scripting.
Setting up a development environment
In order to rapidly develop and debug Python applications, it is necessary to use an Integrated Development Environment (IDE). If you want to try different options, we recommend you check out the list that is on the official Python site, where you can see the tools according to your operating systems and needs:
https://wiki.python.org/moin/IntegratedDevelopmentEnvironments
Out of all the environments, the following two are the ones we will look at:
- Python IDLE: https://docs.python.org/3/library/idle.html
- PyCharm: http://www.jetbrains.com/pycharm
Debugging with Python IDLE
Python IDLE is the default IDE that is installed when you install Python in your operating system. Python IDLE allows you to debug your script and see errors and exceptions in the Python shell console:

Figure 1.1: Running a script in the Python shell
In the preceding screenshot, we can see the output in the Python shell and the exception is related to File not found.
PyCharm
PyCharm (https://www.jetbrains.com/pycharm) is a multi-platform tool that we can find for many operating systems, such as Windows, Linux, and macOS X. There are two versions of PyCharm, community and technical, with variations in functionality relating to web framework integration and support for databases. The main advantages of this development environment are as follows:
- Autocomplete, syntax highlighter, analysis tool, and refactoring
- Integration with web frameworks, such as Django and Flask
- An advanced debugger
- Connection with version control systems, such as Git, CVS, and SVN
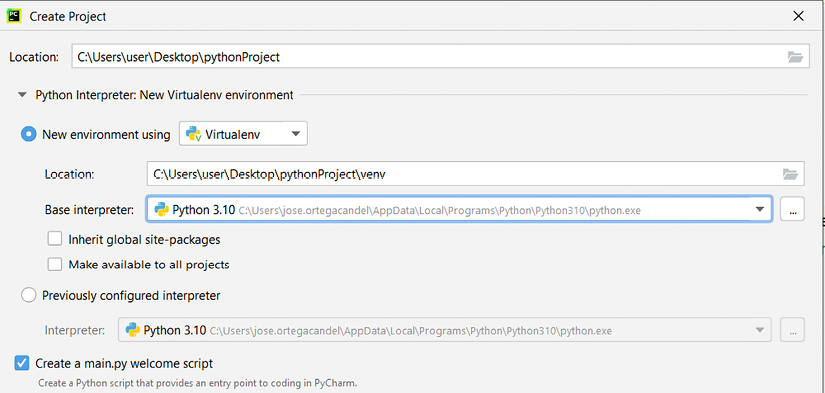
In the following screenshot, we can see how to configure virtualenv in PyCharm:

Figure 1.2: Configuring virtualenv in PyCharm
In the preceding screenshot, we are setting the configuration related to establishing a new environment for the project using Virtualenv.
Debugging with PyCharm
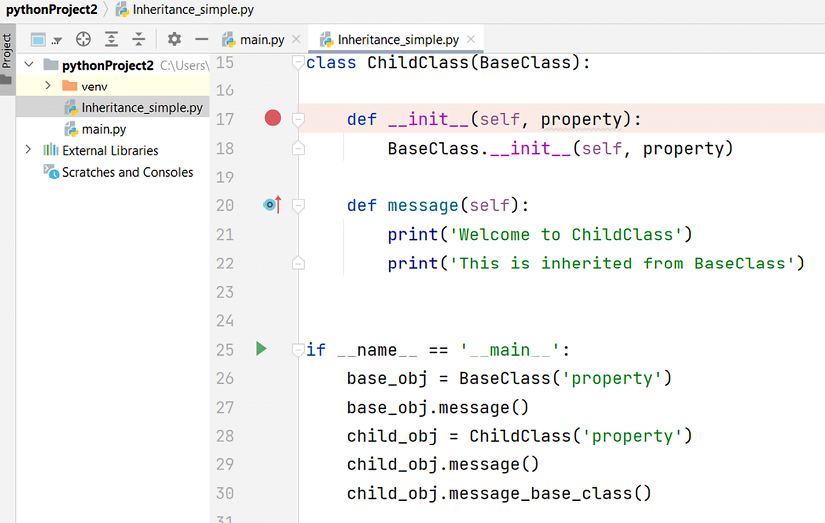
In this example, we are debugging a Python script that is applying simple inheritance. An interesting topic is the possibility of adding a breakpoint to our script. In the following screenshot, we are setting a breakpoint in the __init__ method of the class ChildClass:

Figure 1.3: Setting a breakpoint in PyCharm
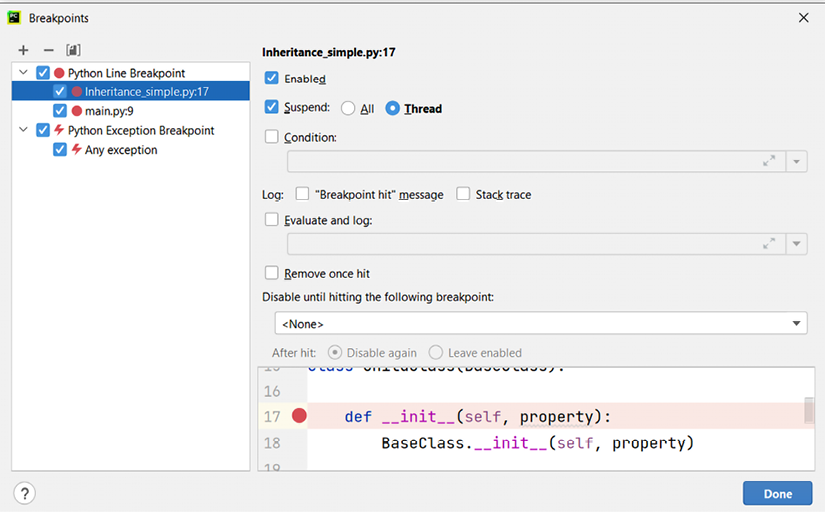
With the View Breakpoint option, we can see the breakpoint established in the script:

Figure 1.4: Viewing breakpoints in PyCharm
In the following screenshot, we can visualize the values of the parameters that contain the values we are debugging:

Figure 1.5: Debugging variables in PyCharm
In this way, we can know the state of each of the variables at runtime, as well as modify their values to change the logic of our script.


