In the interactive mode, we have seen the graph getting built step by step with each instruction. In non-interactive mode, you give all instructions to build the graph and then display the graph with a command explicitly.
Working in non-interactive mode
How to do it...
Working on non-interactive mode won't be difficult either:
- Start the kernel afresh, and import the matplotlib and pyplot libraries:
import matplotlib
import matplotlib.pyplot as plt
- Set the interactive mode to OFF:
plt.ioff()
- Check the status of interactive mode:
matplotlib.is_interactive()
- You should get the output False.
- Execute the following code; you will not see the plot on your screen:
# Plot a line graph
plt.plot([1.5, 3.0])

# Plot the title, X and Y axis labels
plt.title("Non Interactive Mode")
plt.xlabel("X-axis")
plt.ylabel("Y-axis")
- Execute the following statement, and then you will see the plot on your screen:
# Display the graph on the screen
plt.show()
How it works...
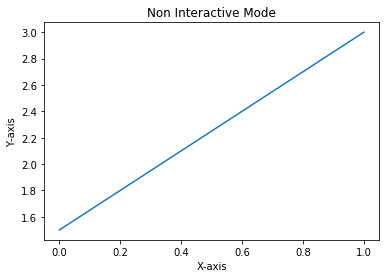
Each of the preceding code statements is self-explanatory. The important thing to note is in non-interactive mode, you write complete code for the graph you want to display, and call plt.show() explicitly to display the graph on the screen.
The following is the output obtained:

The latest versions of Jupyter Notebook seem to display the figure without calling plt.show() command explicitly. However, in Python shell or embedded applications, plt.show() or plt.draw() is required to display the figure on the screen.


