Rendering maps with Tableau
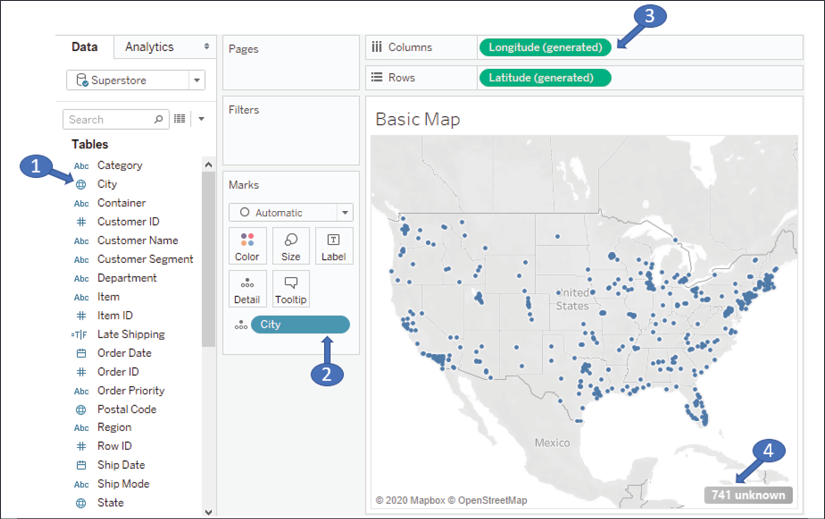
Consider the following screenshot (the Basic Map example in the Chapter 12 workbook), with certain elements numbered for reference:

Figure 12.1: A basic geospatial rendering in Tableau
The numbers indicate some of the important aspects of Tableau's ability to render maps:
- A geographic field in the data is indicated with a globe icon. Fields that Tableau recognizes will have this icon by default. You may assign a geographic role to any field by using the menu and selecting Geographic Role.
- The geographic field in the view (in this case, on Detail) is required to render the map.
- If Tableau is able to match the geographic field with its internal database, the Latitude (generated) and Longitude (generated) fields placed on Rows and Columns along with the geographic field(s) on the Marks card will render a map.
- Values that are not matched with Tableau's geographic database will result in an indicator...


