Search icon CANCEL
Subscription
0
Cart icon
Your Cart (0 item)
Close icon
You have no products in your basket yet
Arrow left icon
Explore Products
Best Sellers
New Releases
Books
Videos
Audiobooks
Learning Hub
Conferences
Free Learning
Arrow right icon
Arrow up icon
GO TO TOP
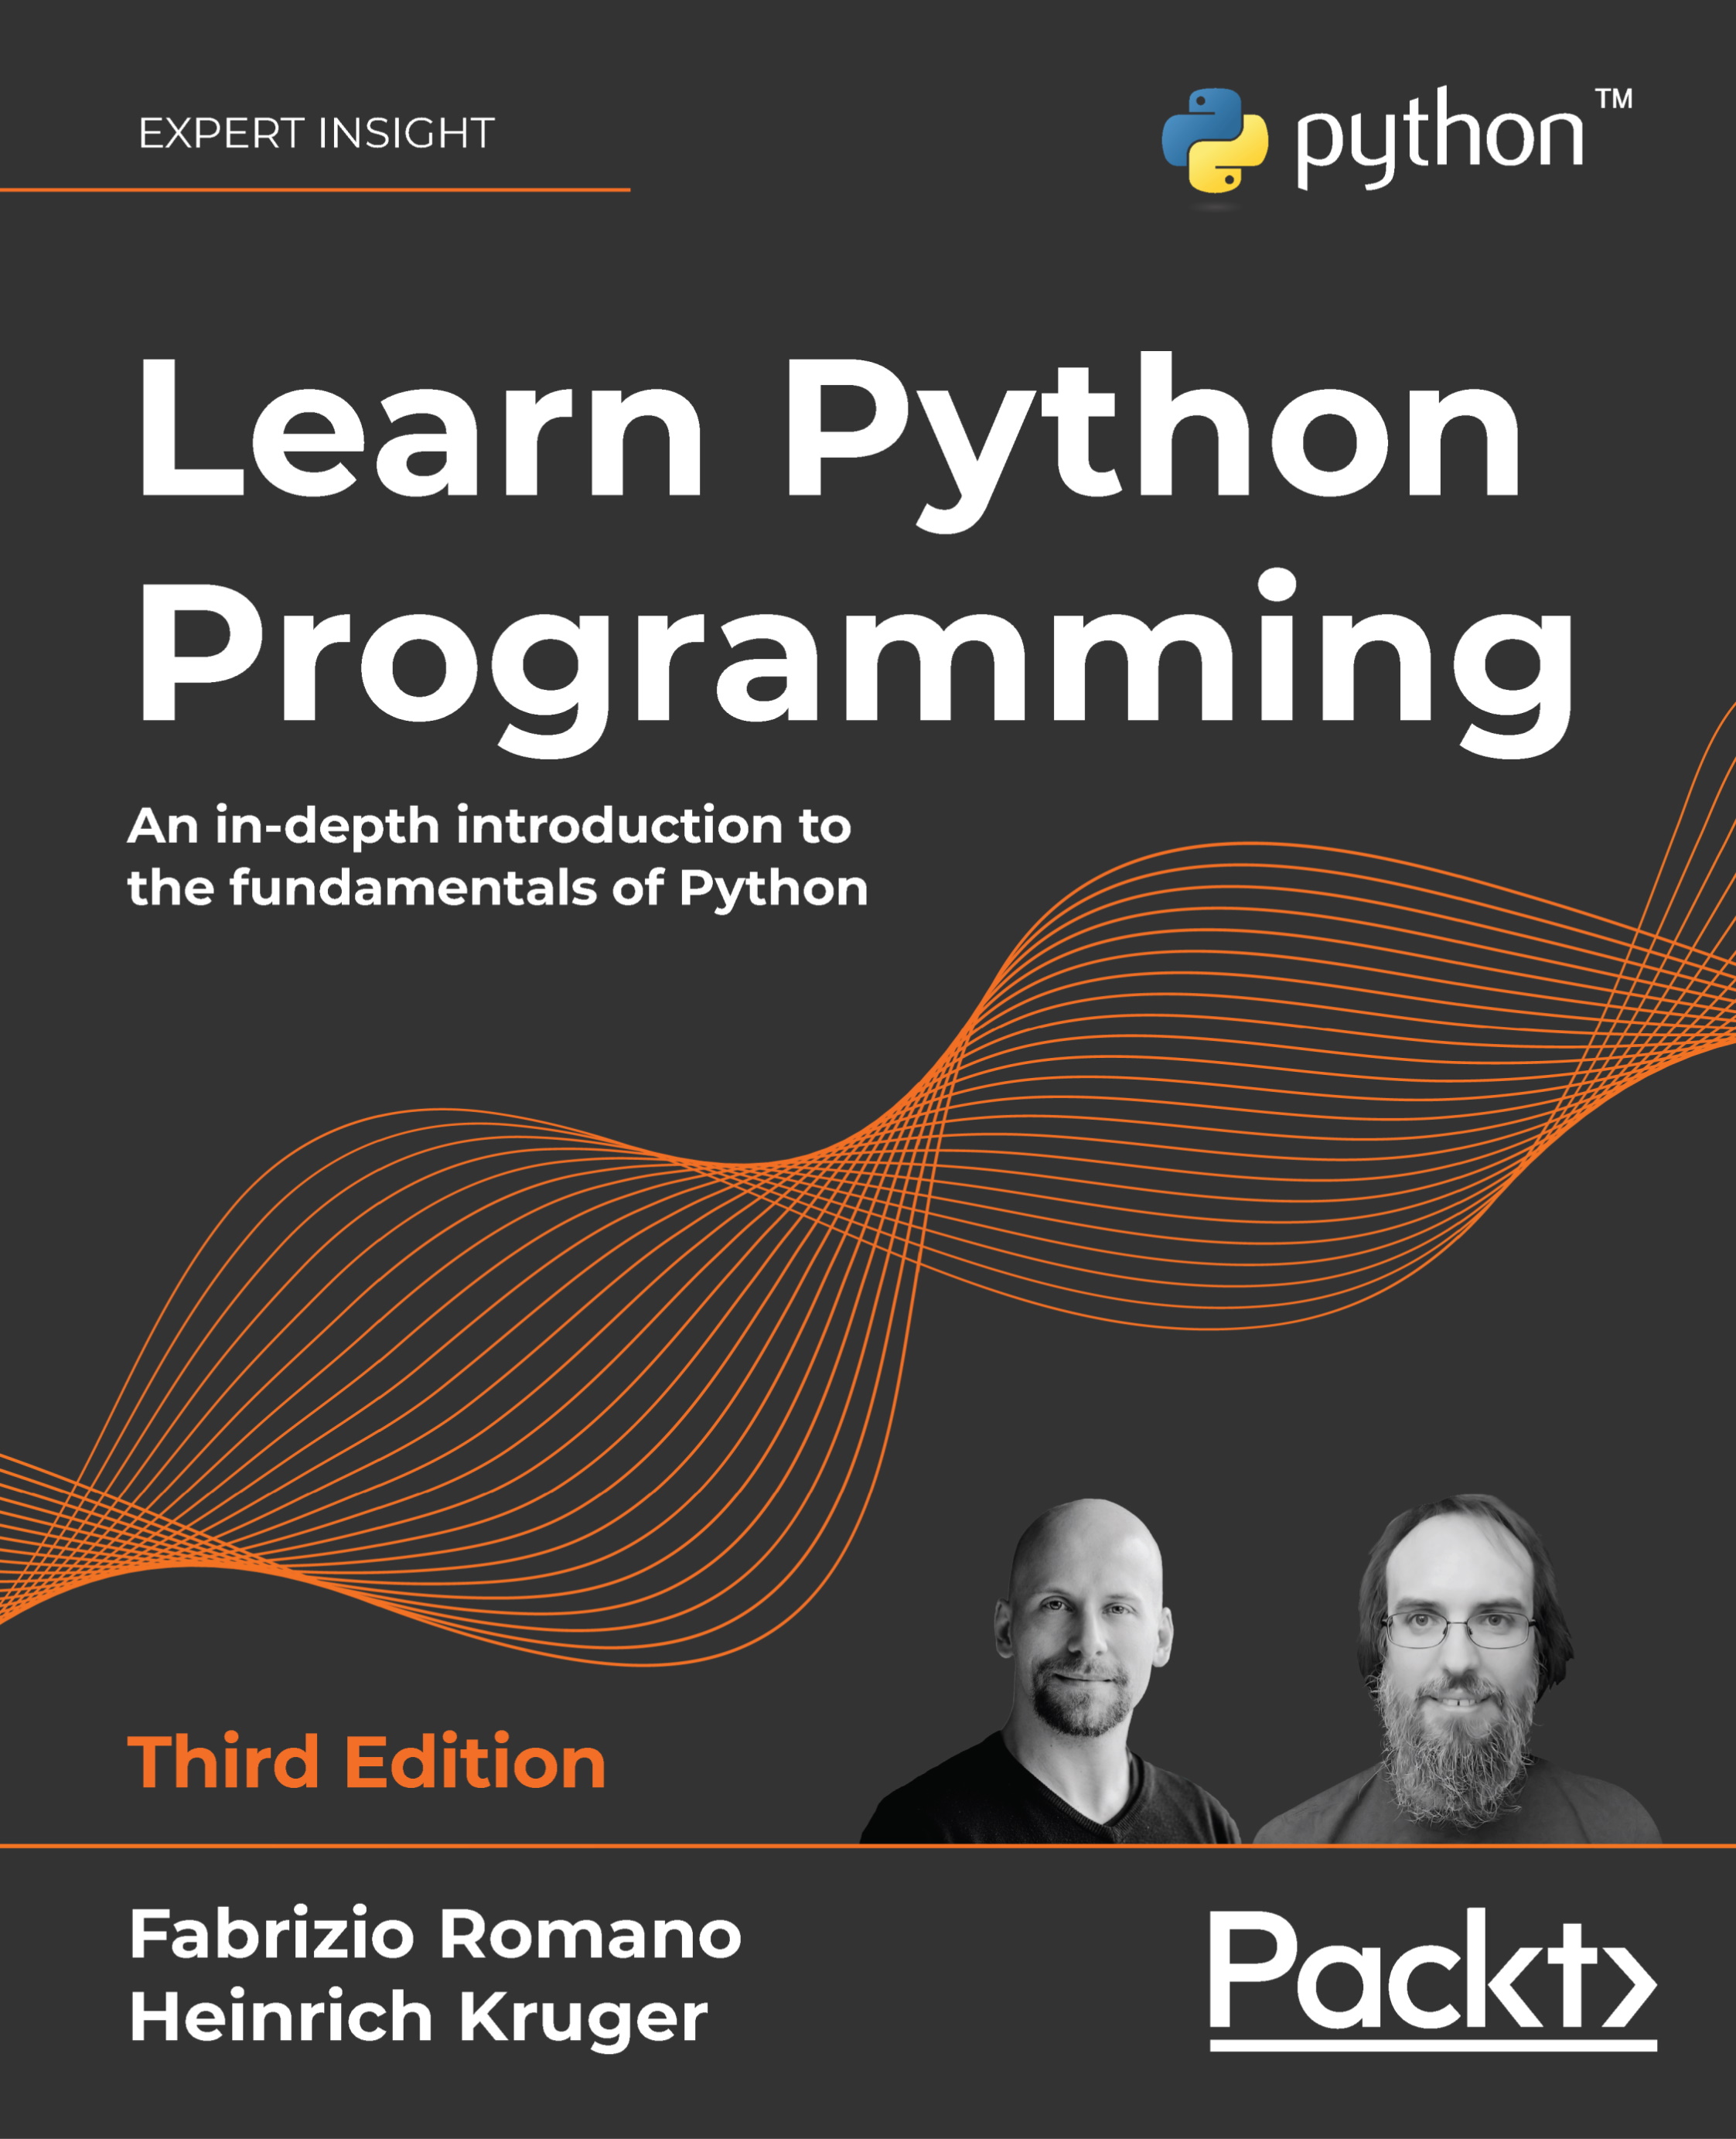
Learn Python Programming, 3rd edition

You're reading from   Learn Python Programming, 3rd edition An in-depth introduction to the fundamentals of Python

Arrow left icon
Product type Paperback
Published in Oct 2021
Publisher Packt
ISBN-13 9781801815093
Length 554 pages
Edition 3rd Edition
Languages
Tools
Arrow right icon
Authors (2):
Arrow left icon
Heinrich Kruger Heinrich Kruger
Author Profile Icon Heinrich Kruger
Heinrich Kruger
Fabrizio Romano Fabrizio Romano
Author Profile Icon Fabrizio Romano
Fabrizio Romano
Arrow right icon
View More author details
Toc

Table of Contents (18) Chapters Close

Preface 1. A Gentle Introduction to Python 2. Built-In Data Types FREE CHAPTER 3. Conditionals and Iteration 4. Functions, the Building Blocks of Code 5. Comprehensions and Generators 6. OOP, Decorators, and Iterators 7. Exceptions and Context Managers 8. Files and Data Persistence 9. Cryptography and Tokens 10. Testing 11. Debugging and Profiling 12. GUIs and Scripting 13. Data Science in Brief 14. Introduction to API Development 15. Packaging Python Applications 16. Other Books You May Enjoy
17. Index

Profiling Python

Profiling means having the application run while keeping track of several different parameters, such as the number of times a function is called and the amount of time spent inside it.

Profiling is closely related to debugging. Although the tools and processes used are quite different, both activities involve probing and analyzing your code to understand where the root of a problem lies and then making changes to fix it. The difference is that instead of incorrect output or crashing, the problem we are trying to solve is poor performance.

Sometimes profiling will point to where the performance bottleneck is, at which point you will need to use the debugging techniques we discussed earlier in this chapter to understand why a particular piece of code does not perform as well as it should. For example, faulty logic in a database query might result in loading thousands of rows from a table instead of just hundreds. Profiling might show you that a particular function...

lock icon The rest of the chapter is locked
Register for a free Packt account to unlock a world of extra content!
A free Packt account unlocks extra newsletters, articles, discounted offers, and much more. Start advancing your knowledge today.
Unlock this book and the full library FREE for 7 days
Get unlimited access to 7000+ expert-authored eBooks and videos courses covering every tech area you can think of
Renews at $19.99/month. Cancel anytime