What was used before observability?
Observability, as a term, this contradicts what you say a couple of sentences later, where you say the term was coined in 1960. please review the wording of this paragraph, with Google’s definition stating “observability is defined as a measure of how well internal states of a system can be inferred from knowledge of its external outputs.” This started doing rounds in technical talks and presentations. This definition was coined by engineer Rudolf E. Kálmán in 1960 in his paper on control theory. In the modern IT world, observability is just a concept. Even before it became the talk of the town, some engineers were probably already building rounded monitoring systems and the ecosystem around it that made their services observable. It’s just that they did not know the buzzword!
In a single instance of a web application, you can add some scripting to check the service’s status, use Nagios to monitor the infrastructure, write smart logs and scrape them with scripts or some tool to keep an eye on connectivity and errors, plug results into a ticketing system such as BMC or set up SNMP traps, and there you go! The system is observable, yes that’s true – all aspects of the system are covered, engineers have a hold on the infrastructure and services, they know whether the systems have connectivity, and tickets are raised when something goes wrong. It’s all there. Hold on – there is something still missing though, which we will discover at the end of this section.
When thinking of what was used before observability, we are not talking about mainframe systems that were a black box for decades until some bright brains opened up that tough nut with Syncsort; there is no need to start from the beginning to understand what was used before observability. In the 90s, software and desktops were batch-oriented, had single instances, and focused less on the GUI. The outputs that they emitted were either hardware signals or code that only a few skilled technicians could decipher. With the advent of sophisticated OSs such as Linux, the game started to evolve and you might be surprised that, for a long time, humble commands such as vmstat, top, and syslogs were sought after as monitoring tools for Linux and Unix-based OSs. But we will not start from there either.
As an example, take a look at the following figure for a quick contrast between the humble beginnings of monitoring and its current state:

Figure 1.1 – Monitoring then (left) and now (right) (Creative Commons—Attribution 2.0 Generic—CC BY 2.0)
Let’s fast forward a bit. The world started shrinking with the internet when the era of eCommerce started. All of a sudden, single-instance apps started evolving into monolithic apps (which we know entered the black hole soon after). And this is where we will start!
With eCommerce, infrastructure monitoring and traffic-light monitoring of services was not enough. Businesses needed frequent metrics on products, web traffic, and, most importantly, user behavior to assess current business and actionable insights to make future decisions for expansion. These came to be known as business metrics – data for the eyes of the executives. Logs being produced could no longer be at the mercy of the developers; logging frameworks and normalization techniques were introduced to help developers produce meaningful logs that could be used to derive application health and business metrics. Early-age monitoring tools such as Cacti, Nagios, scripts (shell or Python), and some commands could only cater to a handful of the monitoring requirements. Areas such as APM, customer behavior analytics, and measuring incident impact on customers remained largely untouched. As eCommerce platforms gained popularity, the volume of customers increased, and data volumes started exploding way beyond the capacity of the available monitoring tools. System architectures evolved from monolithic to distributed, making it even more difficult for traditional monitoring techniques to provide meaningful insights.
As the tech stack was increasing, each technology or tool started offering a monitoring tool. Windows had Event Viewer and SCOM, Linux had its commands, databases had RockSolid and OEM, Unix had HP products, and Apache servers had highly structured standard logs – this list can go on. Soon, the monitoring space was cluttered with micro-monitoring tools when the need was to have macro monitoring that could provide an end-to-end unified view of the distributed platforms consisting of various technologies.
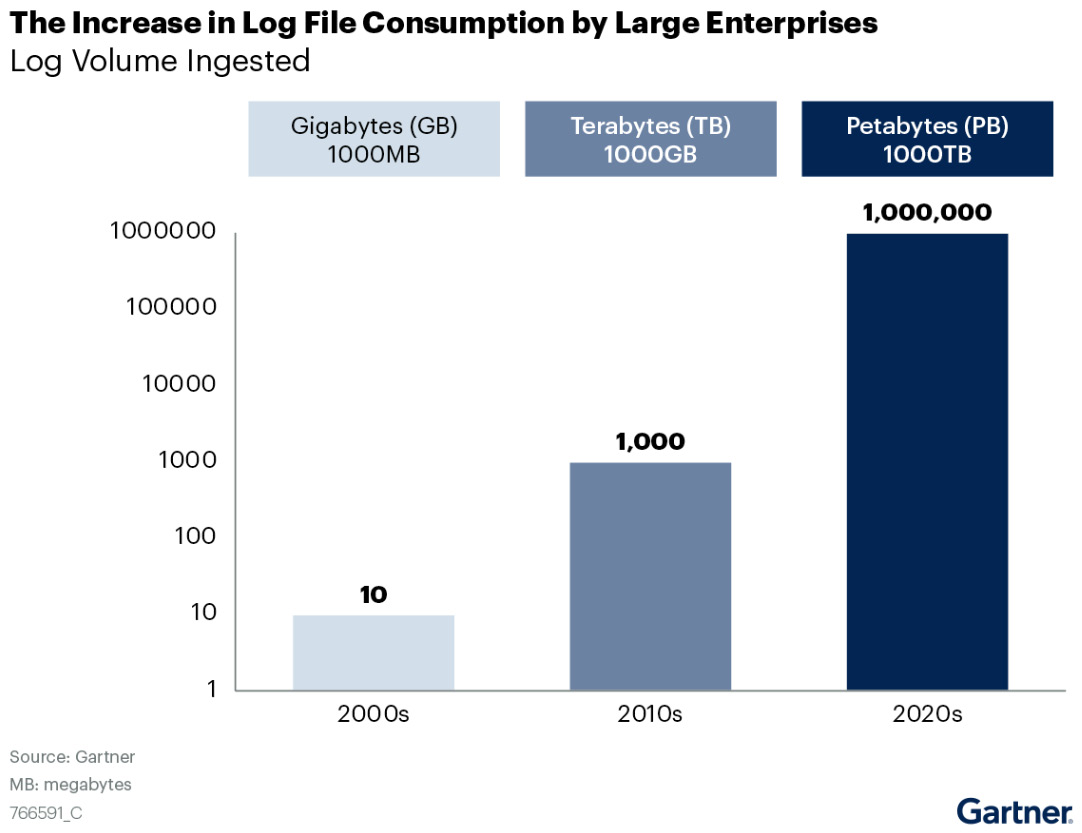
As per Gartner’s report, log volumes have increased 1,000 times in the last 10 years! And, all these monitoring tools and utilities have started consuming more and more data and keep evolving:

Figure 1.2 – Log volume ingestion growth (source: Gartner)
So, before observability, there was only monitoring, which was limited to a particular technology in most cases. Then, a lot of big data monitoring tools were introduced, such as AppDynamics, New Relic, Splunk, Dynatrace, and others, that could collect data from various sources and make it available to end users on a single screen. The micro-based monitoring bubbles soon started converging toward these tools and a mature ecosystem started shaping up. When you look at the fancy visualizations that these tools offer, it’s hard to believe that monitoring in its primitive days was based on hardware-based signals, commands, and scripts.


