The matplotlib API primer
The easiest way to get started with plotting using matplotlib is often by using the MATLAB API that is supported by the package:
>>> import matplotlib.pyplot as plt
>>> from numpy import *
>>> x = linspace(0, 3, 6)
>>> x
array([0., 0.6, 1.2, 1.8, 2.4, 3.])
>>> y = power(x,2)
>>> y
array([0., 0.36, 1.44, 3.24, 5.76, 9.])
>>> figure()
>>> plot(x, y, 'r')
>>> xlabel('x')
>>> ylabel('y')
>>> title('Data visualization in MATLAB-like API')
>>> plt.show()
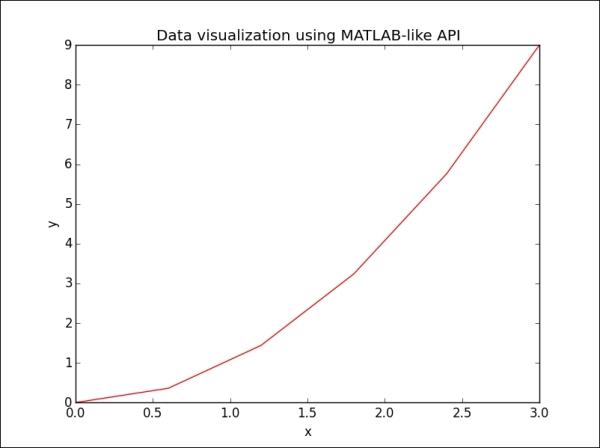
The output for the preceding command is as follows:

However, star imports should not be used unless there is a good reason for doing so. In the case of matplotlib, we can use the canonical import:
>>> import matplotlib.pyplot as plt
The preceding example could then be written as follows:
>>> plt.plot(x, y)
>>> plt.xlabel('x')
>>> plt.ylabel('y')
>>> plt.title('Data visualization...


