(For more resources related to this topic, see here.)
Getting ready
For this article, you will just need a premium version of VS2013 or you may use VS Express for Windows Desktop. Be sure to run your choice on a machine using a 64-bit edition of Windows. Note that Edit and Continue previously existed for 32-bit code.
How to do it…
Both features are now supported by C#/VB, but we will be using C# for our examples. The features being demonstrated are compiler-based features, so feel free to use code from one of your own projects if you prefer. To see how Edit and Continue can benefit 64-bit development, perform the following steps:
- Create a new C# Console Application using the default name.
- To ensure the demonstration is running with 64-bit code, we need to change the default solution platform.
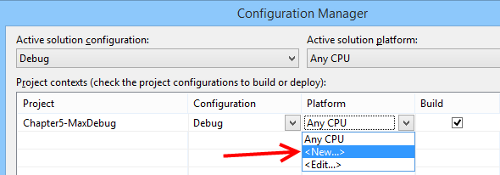
- Click on the drop-down arrow next to Any CPU and select Configuration Manager…:

- When the Configuration Manager dialog opens, we can create a new Project Platform targeting 64-bit code. To do this, click on the drop-down menu for Platform and select <New...>:

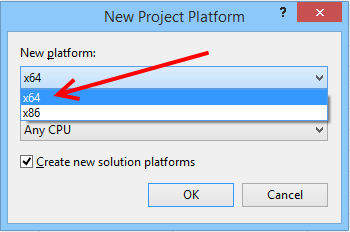
- When <New...> is selected, it will present the New Project Platform dialog box. Select x64 as the new platform type:

- Once x64 has been selected, you will return to the Configuration Manager. Verify that x64 remains active under Platform and then click on Close to close this dialog. The main IDE window will now indicate that x64 is active:

- Now, let's add some code to demonstrate the new behavior. Replace the existing code in your blank class file so that it looks like the following listing:
class Program
{
static void Main(string[] args)
{
int w = 16;
int h = 8;
Debugging Your .NET Application
156
int area = calcArea(w, h);
Console.WriteLine("Area: " + area);
}
private static int calcArea(int width, int height) {
return width / height;
}
}
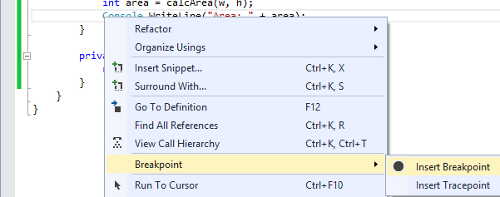
- Let's set some breakpoints so that we are able to inspect during execution. First, add a breakpoint to the Main method's Console line. Add a second breakpoint to the calcArea method's return line. You can do this by either clicking on the left side of the editor window's border or by right-clicking on the line, and selecting Breakpoint | Insert Breakpoint:

- If you are not sure where to click, use the right-click method and then practice toggling the breakpoint by left-clicking on the breakpoint marker. Feel free to use any method that you find most convenient.
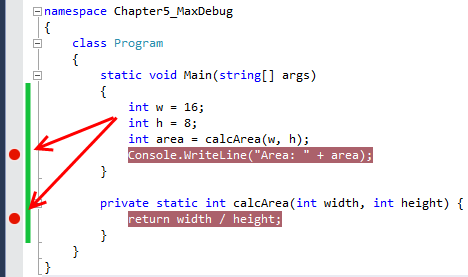
Once the two breakpoints are added, Visual Studio will mark their location as shown in the following screenshot (the arrow indicates where you may click to toggle the breakpoint):
Unlock access to the largest independent learning library in Tech for FREE!
Get unlimited access to 7500+ expert-authored eBooks and video courses covering every tech area you can think of.
Renews at £16.99/month. Cancel anytime

- With the breakpoint marker now set, let's debug the program. Begin debugging by either pressing F5 or clicking on the Start button on the toolbar:

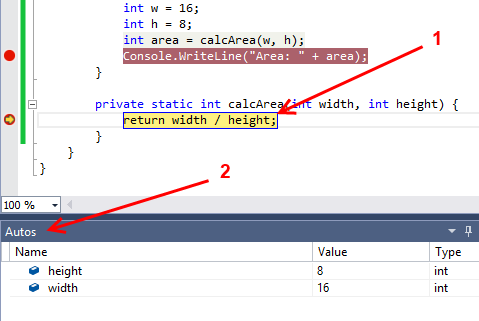
- Once debugging starts, the program will quickly execute until stopped by the first breakpoint. Let's first take a look at Edit and Continue. Visual Studio will stop at the calcArea method's return line. Astute readers will notice an error (marked by 1 in the following screenshot) present in the calculation as the area value returned should be width * height. Make the correction.
- Before continuing, note the variables listed in the Autos window (marked by 2 in the following screenshot). If you don't see Autos, it can be made visible by pressing Ctrl + D, A or through Debug | Windows | Autos while debugging.

- After correcting the area calculation, advance the debugging step by pressing F10 twice. (Alternatively make the advancement by selecting the menu item Debug | Step Over twice). Visual Studio will advance to the declaration for area. Note that you were able to edit your code and continue debugging without restarting.
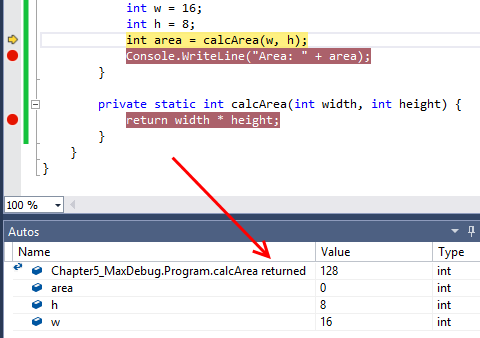
- The Autos window will update to display the function's return value, which is 128 (the value for area has not been assigned yet):

There's more…
Programmers who write C++ already have the ability to see the return values of functions; this just brings .NET developers into the fold. Your development experience won't have to suffer based on the languages chosen for your projects.
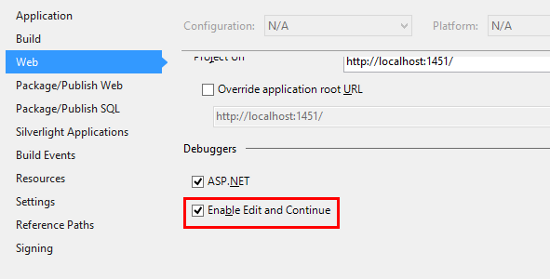
The Edit and Continue functionality is also available for ASP.NET projects. New projects created in VS2013 will have Edit and Continue enabled by default. Existing projects imported to VS2013 will usually need this to be enabled if it hasn't been already. To do so, right-click on your ASP.NET project in Solution Explorer and select Properties (alternatively, it is also available via Project | <Project Name> Properties…). Navigate to the Web option and scroll to the bottom to check the Enable Edit and Continue checkbox. The following screenshot shows where this option is located on the properties page:

Summary
In this article, we learned how to use the Edit and Continue feature. Using this feature enables you to make changes to your project without having to immediately recompile your project. This simplifies debugging and enables a bit of exploration. You also saw how the Autos window can display the values of variables as you step through your program’s execution.
Resources for Article:
Further resources on this subject:
 United States
 Great Britain
 India
India
 Germany
 France
 Canada
 Russia
 Spain
Spain
 Brazil
 Australia
 Singapore
 Hungary
 Ukraine
 Luxembourg
 Estonia
 Lithuania
 South Korea
 Turkey
 Switzerland
 Colombia
 Taiwan
 Chile
Chile
 Norway
 Ecuador
 Indonesia
 New Zealand
 Cyprus
 Denmark
 Finland
 Poland
 Malta
Malta
 Czechia
 Austria
 Sweden
 Italy
Italy
 Egypt
Egypt
 Belgium
 Portugal
 Slovenia
 Ireland
 Romania
 Greece
 Argentina
 Netherlands
 Bulgaria
 Latvia
 South Africa
 Malaysia
 Japan
Japan
 Slovakia
 Philippines
 Mexico
 Thailand


