


Matrices in R
In this recipe, we will dive into R's capability with regard to matrices.
How to do it…
A vector in R is defined using the c() notation as follows:
vec = c(1:10)
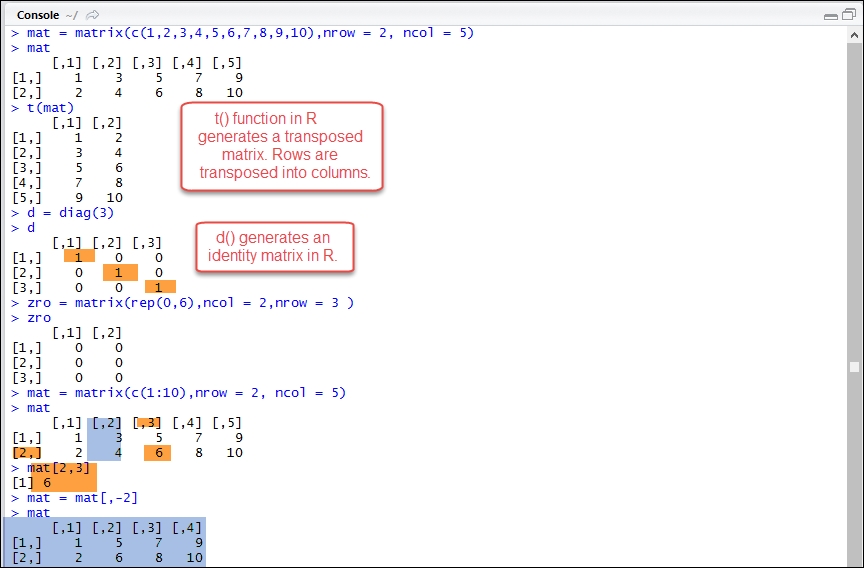
A vector is a one-dimensional array. A matrix is a multidimensional array. We can define a matrix in R using the matrix() function. Alternatively, we can also coerce a set of values to be a matrix using the as.matrix() function:
mat = matrix(c(1,2,3,4,5,6,7,8,9,10),nrow = 2, ncol = 5)
mat
To generate a transpose of a matrix, we can use the t() function:
t(mat) # transpose a matrix
In R, we can also generate an identity matrix using the diag() function:
d = diag(3) # generate an identity matrix
We can nest the rep () function within matrix() to generate a matrix with all zeroes as follows:
zro = matrix(rep(0,6),ncol = 2,nrow = 3 )# generate a matrix of Zeros
zro
How it works…
We can define our data in the matrix () function by specifying our data as its first argument. The nrow and ncol arguments are used to specify the number of rows and column in a matrix. The matrix function in R comes with other useful arguments and can be studied by typing ?matrix in the R command window.
The rep() function nested in the matrix() function is used to repeat a particular value or character string a certain number of times.
The diag() function can be used to generate an identity matrix as well as extract the diagonal elements of a matrix. More uses of the diag() function can be explored by typing ?diag in the R console window.
The code file provides a lot more functions that can used along with matrices—for example, functions related to finding a determinant or inverse of a matrix and matrix multiplication.


