While Chapter 2, Installing the Elastic Stack with Machine Learning, will focus on the installation and setup of the product itself, it is good to understand a few key concepts of how ML works from a logistical perspective—where things run and when—and which processes and indices are involved in this complex orchestration.
Operationalization
Jobs
In Elastic's ML, the job is the unit of work, similar to what a watch is for Elastic's alerting. As we will see in more depth later, the main configuration elements of a job are as follows:
- Job name/ID
- Analysis bucketization window (the Bucket span)
- The definition and settings for the query to obtain the raw data to be analyzed (the datafeed)
- The anomaly detection configuration recipe (the Detector)
ML jobs are independent and autonomous. Multiples can be running at once, doing independent things and analyzing data from different indices. Jobs can analyze historical data, real-time data, or a mixture of the two. Jobs can be created using the Machine Learning UI in Kibana, or programmatically via the API. They also require ML-enabled nodes.
ML nodes
First and foremost, since Elasticsearch is, by nature, a distributed multi-node solution, it is only natural that the ML feature of the Elastic Stack works as a native plugin that obeys many of the same operational concepts. As described in the documentation, ML can be enabled on any or all nodes, but it is a best practice in a production system to have dedicated ML nodes. This is helpful to optimize the types of resources specifically required by ML. Unlike data nodes that are involved in a fair amount of I/O load due to indexing and searching, ML nodes are more compute and memory intensive. With this knowledge, you can size the hardware appropriately for dedicated ML nodes.
One key thing to note—the ML algorithms do not run in the JVM. They are C++-based executables that will use the RAM that is left over from whatever is allocated for the Java Virtual Machine (JVM) heap. When running a job, the main process that invokes the analysis (called autodetect) can be seen in the process list:

View of top processes when a ML job is running
There will be one autodetect process for every actively running ML job. In multi-node setups, ML will distribute the jobs to each of the ML-enabled nodes to balance the load of the work.
Bucketization
Bucketing input data is an important concept to understand in ML. Set with a key parameter at the job level called bucket_span, the input data from the datafeed (described next) is collected into mini batches for processing. Think of the bucket span as a pre-analysis aggregation interval—the window of time in which a portion of the data is aggregated over for the purposes of analysis. The shorter the duration of the bucket_span, the more granular the analysis, but also the higher the potential for noisy artifacts in the data.
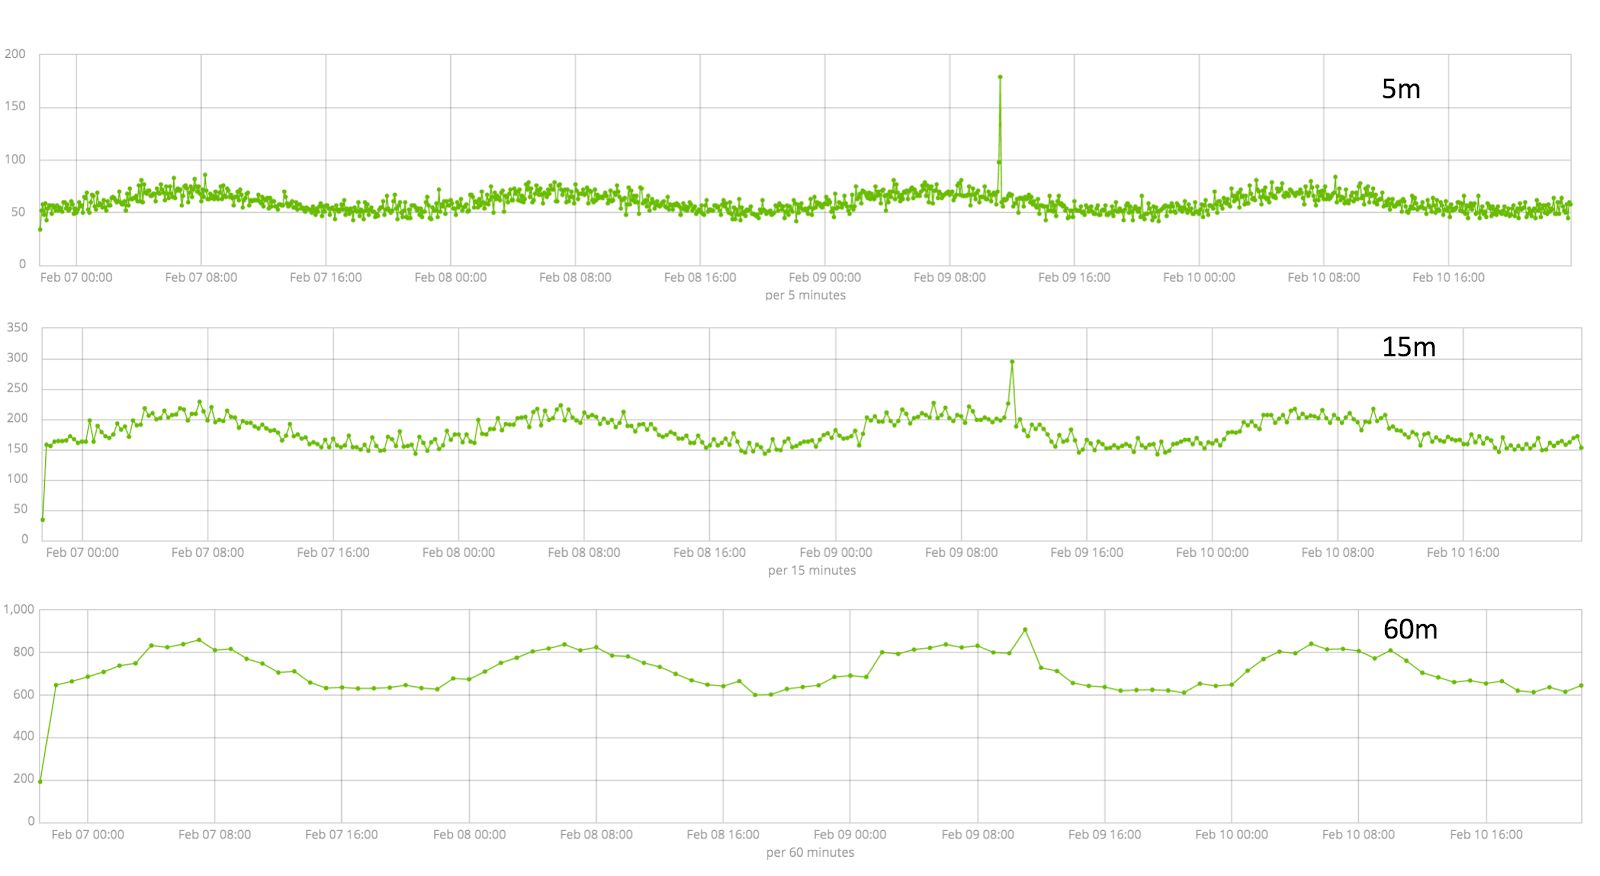
The following graph shows the same dataset aggregated over three different intervals:

Notice that the prominent anomalous spike seen in the version aggregated over the 5-minute interval becomes all but lost if the data is aggregated over a 60-minute interval due to the fact of the spike's short (<2 minute) duration. In fact, at this 60-minute interval, the spike doesn't even seem that anomalous anymore.
This is a practical consideration for the choice of bucket_span. On one hand, having a shorter aggregation period is helpful because it will increase the frequency of the analysis (and thus reduce the interval of notification on if there is something anomalous), but making it too short may highlight features in the data that you don't really care about. If the brief spike that's shown in the preceding data is a meaningful anomaly for you, then the 5-minute view of the data is sufficient. If, however, a perturbation of the data that's very brief seems like an unnecessary distraction, then avoid a low value of bucket_span.
The datafeed
ML obviously needs data to analyze (and use to build and mature the statistical models). This data comes from your time series indices in Elasticsearch. The datafeed is the mechanism by which this data is retrieved (searched) on a routine basis and presented to the ML algorithms. Its configuration is mostly obscured from the user, except in the case of the creation of an advanced job in the UI (or by using the ML API). However, it is important to understand what the datafeed is doing behind the scenes.
Similar to the concept of a watch input in alerting, the datafeed will routinely query for data against the index, which contains the data to be analyzed. How often the data (and how much data at a time) the datafeed queries depends on a few factors:
- bucket_span: We have already established that bucket_span controls the width of the ongoing analysis window. Therefore, the job of the datafeed is to make sure that the buckets are full of chronologically ordered data. You can therefore see that the datafeed will make a date range query to Elasticsearch.
- frequency: A parameter that controls how often the raw data is physically queried. If this is between 2 and 20 minutes, frequency will equal bucket_span (as in, query every 5 minutes for the last 5 minutes' worth of data). If the bucket_span is longer, the frequency, by default, will be a smaller number (more frequent) so that the overall long interval is not expected to be queried all at once. This is helpful if the dataset is rather voluminous. In other words, the interval of a long bucket_span will be chopped up into smaller intervals simply for the purposes of querying.
- query_delay: This controls the amount of time "behind now" that the datafeed should query for a bucket span's worth of data. The default is 60s. Therefore, with a bucket_span value of 5m and a query_delay value of 60s at 12:01 PM, the datafeed will request data in the range of 11:55 AM to midnight. This extra little delay allows for delays in the ingest pipeline to ensure no data is excluded from the analysis if its ingestion is delayed for any reason.
- scroll_size: In most cases, the type of search that the datafeed executes to Elasticsearch uses the scroll API. Scroll size defines how much the datafeed queries to Elasticsearch at a time. For example, if the datafeed is set to query for log data every 5 minutes, but in a typical 5-minute window there are 1 million events, the idea of scrolling that data means that not all 1 million events will be expected to be fetched with one giant query. Rather, it will do it with many queries in increments of scroll_size. By default, this scroll size is set conservatively to 1,000. So, to get 1 million records returned to ML, the datafeed will ask Elasticsearch for 1,000 rows, a thousand times. Increasing scroll_size to 10,000 will make the number of scrolls be reduced to a hundred. In general, beefier clusters should be able to handle a larger scroll_size and thus be more efficient in the overall process.
There is an exception, however, in the case of a single metric job. The single metric job (described more later) is a simple ML job that allows only one time series metric to be analyzed. In this case, the scroll API is not used to obtain the raw data—rather, the datafeed will automatically create a query aggregation (using the date_histogram aggregation). This aggregation technique can also be used for an advanced job, but it currently requires direct editing of the job's JSON configuration and should be reserved for expert users.


