Search icon CANCEL
Subscription
0
Cart icon
Your Cart (0 item)
Close icon
You have no products in your basket yet
Save more on your purchases! discount-offer-chevron-icon
Savings automatically calculated. No voucher code required.
Arrow left icon
Explore Products
Best Sellers
New Releases
Books
Videos
Audiobooks
Learning Hub
Free Learning
Arrow right icon
Arrow up icon
GO TO TOP
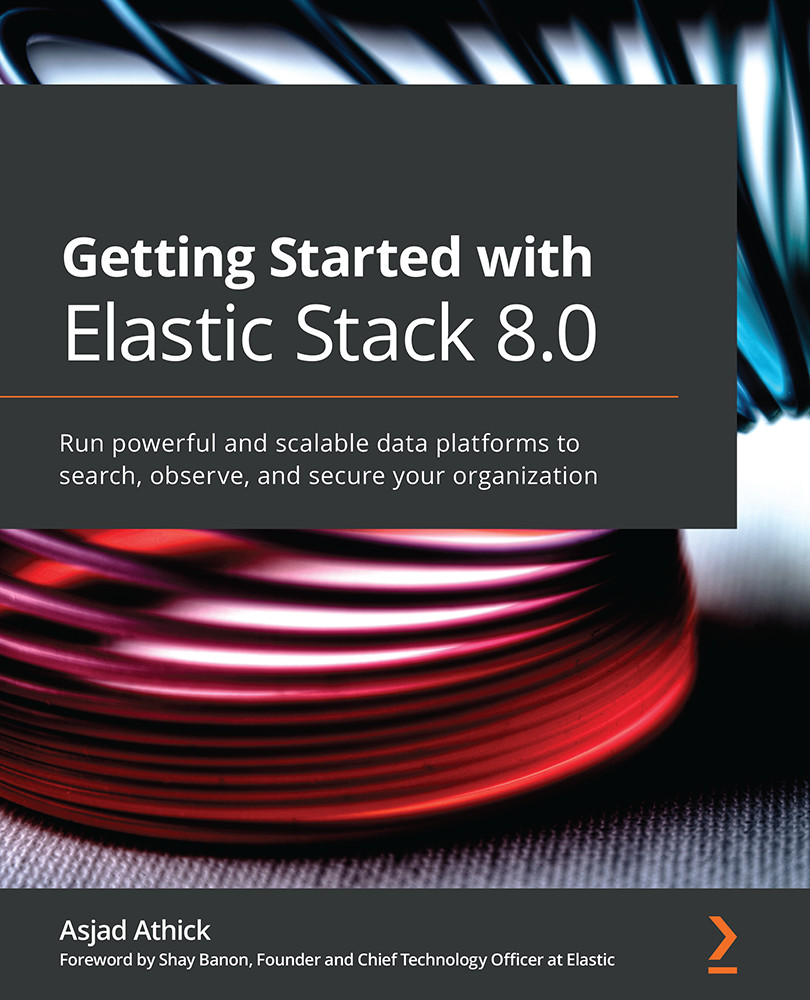
Getting Started with Elastic Stack 8.0

You're reading from   Getting Started with Elastic Stack 8.0 Run powerful and scalable data platforms to search, observe, and secure your organization

Arrow left icon
Product type Paperback
Published in Mar 2022
Publisher Packt
ISBN-13 9781800569492
Length 474 pages
Edition 1st Edition
Arrow right icon
Author (1):
Arrow left icon
Asjad Athick Asjad Athick
Author Profile Icon Asjad Athick
Asjad Athick
Arrow right icon
View More author details
Toc

Table of Contents (18) Chapters Close

Preface 1. Section 1: Core Components
2. Chapter 1: Introduction to the Elastic Stack FREE CHAPTER 3. Chapter 2: Installing and Running the Elastic Stack 4. Section 2: Working with the Elastic Stack
5. Chapter 3: Indexing and Searching for Data 6. Chapter 4: Leveraging Insights and Managing Data on Elasticsearch 7. Chapter 5: Running Machine Learning Jobs on Elasticsearch 8. Chapter 6: Collecting and Shipping Data with Beats 9. Chapter 7: Using Logstash to Extract, Transform, and Load Data 10. Chapter 8: Interacting with Your Data on Kibana 11. Chapter 9: Managing Data Onboarding with Elastic Agent 12. Section 3: Building Solutions with the Elastic Stack
13. Chapter 10: Building Search Experiences Using the Elastic Stack 14. Chapter 11: Observing Applications and Infrastructure Using the Elastic Stack 15. Chapter 12: Security Threat Detection and Response Using the Elastic Stack 16. Chapter 13: Architecting Workloads on the Elastic Stack 17. Other Books You May Enjoy

Using Metricbeat to monitor system and application metrics

Logs make up one aspect of data collection and visibility of a workload you need to monitor. Metrics are a great way to monitor and observe a workload as they represent the internal state of the component at any given point in time.

By correlating logs and metrics, an engineer or developer can quickly understand what a component is doing and how the internal state of the component is changing based on its activities in a given scenario. This is often a useful tool when troubleshooting and resolving issues related to the component in question.

In this section, we will look at collecting some metrics from the nginx web server as well as the host that the server runs on.

Follow the instructions to start collecting system and application metrics using Metricbeat:

  1. Ensure nginx is configured to expose an internal API to collect server metrics.
  2. Edit the /etc/nginx/sites-enabled/default file and add the following...
lock icon The rest of the chapter is locked
Register for a free Packt account to unlock a world of extra content!
A free Packt account unlocks extra newsletters, articles, discounted offers, and much more. Start advancing your knowledge today.
Unlock this book and the full library FREE for 7 days
Get unlimited access to 7000+ expert-authored eBooks and videos courses covering every tech area you can think of
Renews at $19.99/month. Cancel anytime
Banner background image