
Tableau
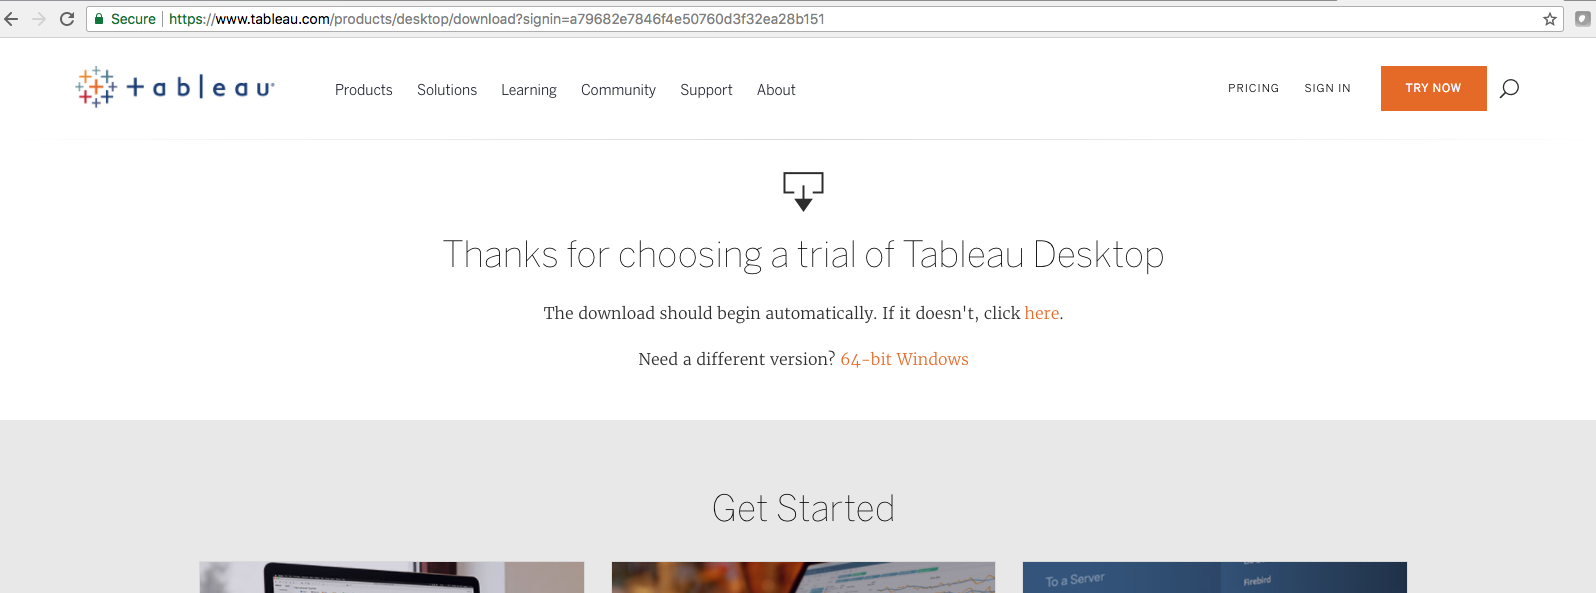
In this section, we will set up Tableau, which is a very popular visualization tool. For this, we can simply download a trial version of Tableau and install it on our local machine. You can find Tableau at https://www.tableau.com/.
The following screenshot shows the download link for Tableau:
Once you've installed the trial version (or if you already have a licensed copy available), you are ready to go through some basic visualization exercises.
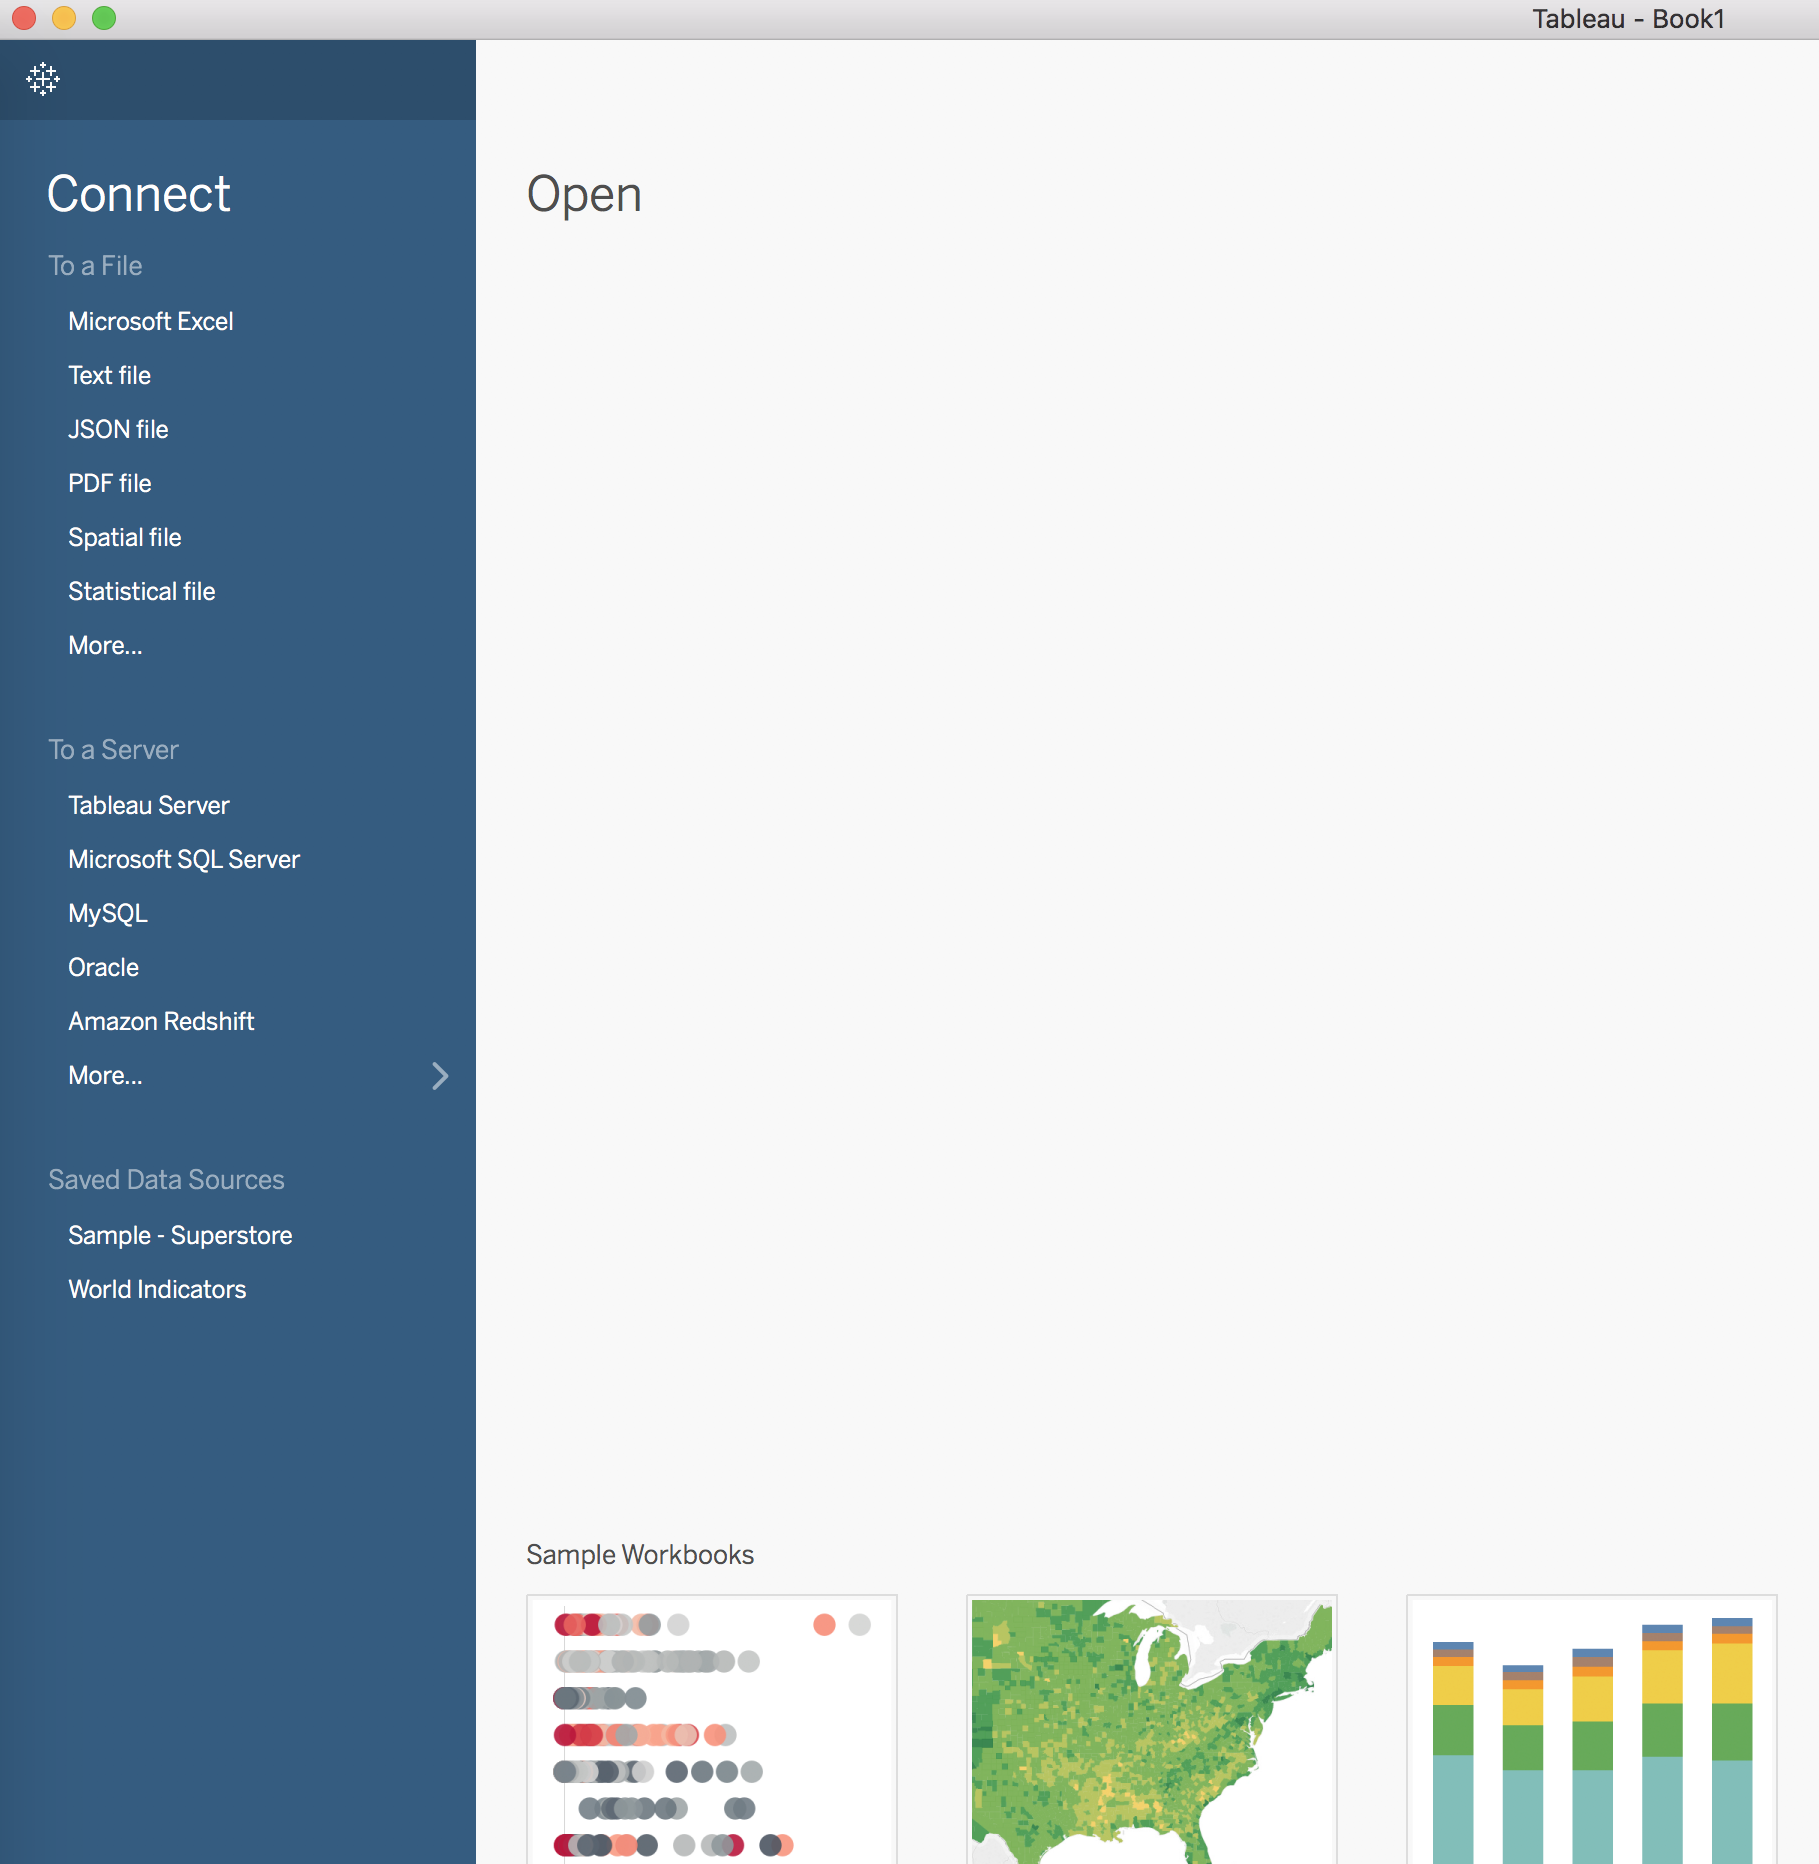
The following is a screenshot of the launch of Tableau, where you will see the various sources of data you can start with:
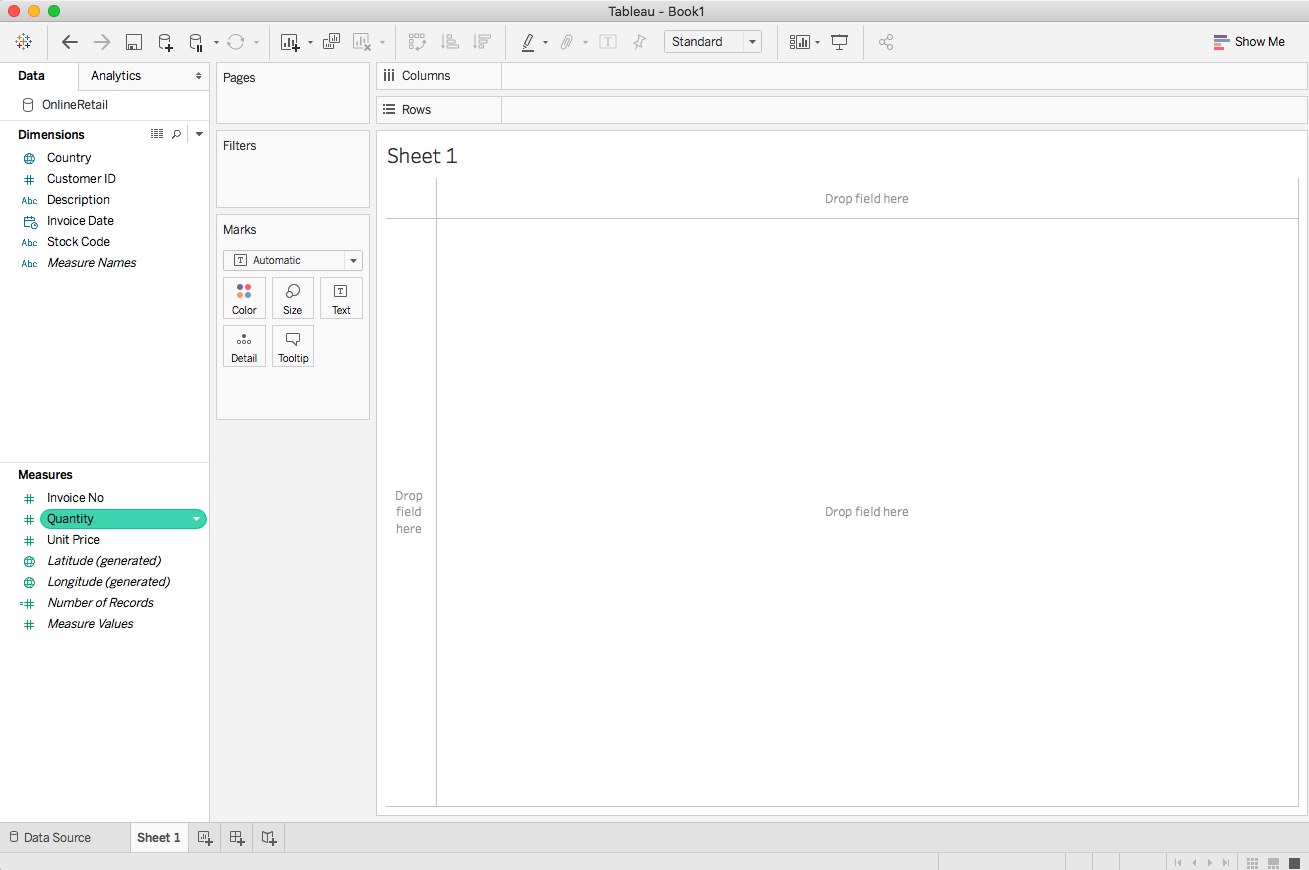
Let's start by opening the file OnlineRetail.csv. The following is a screenshot of the blank worksheet:
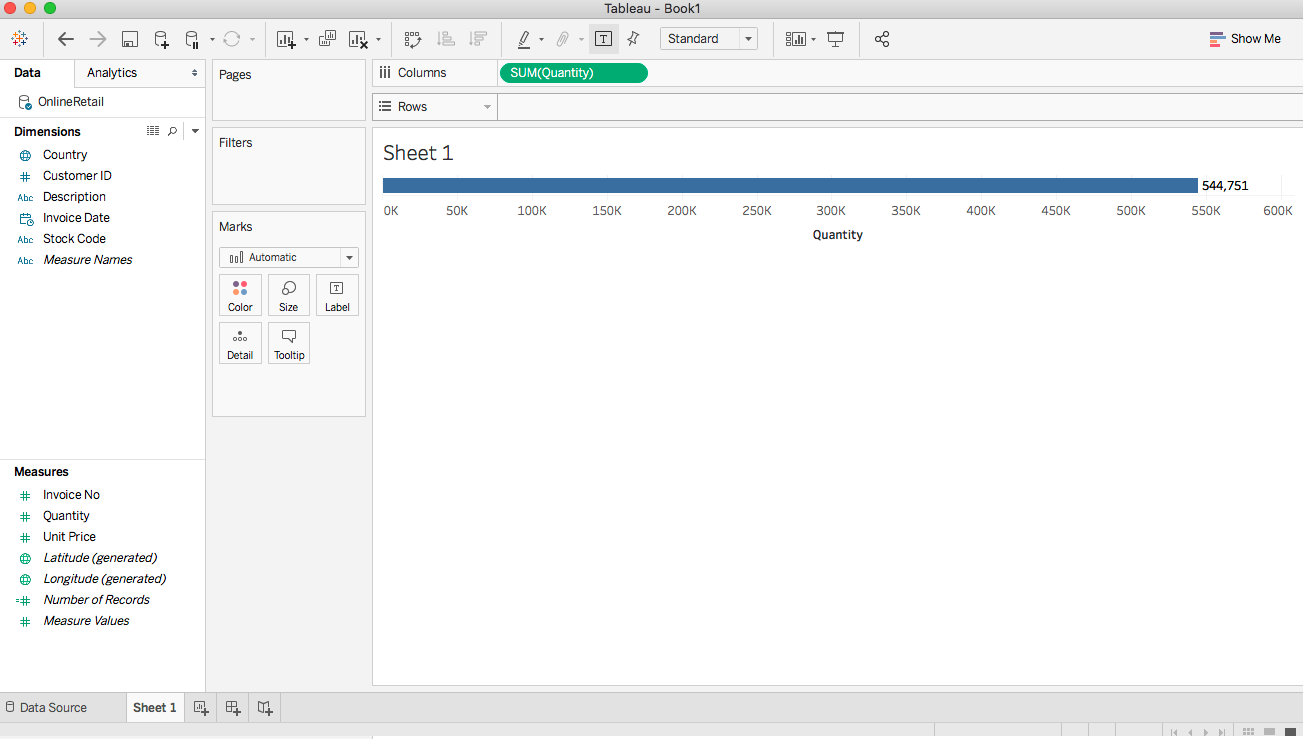
Select the Quantity as a column to see a bar chart with one bar, as shown in the following screenshot:
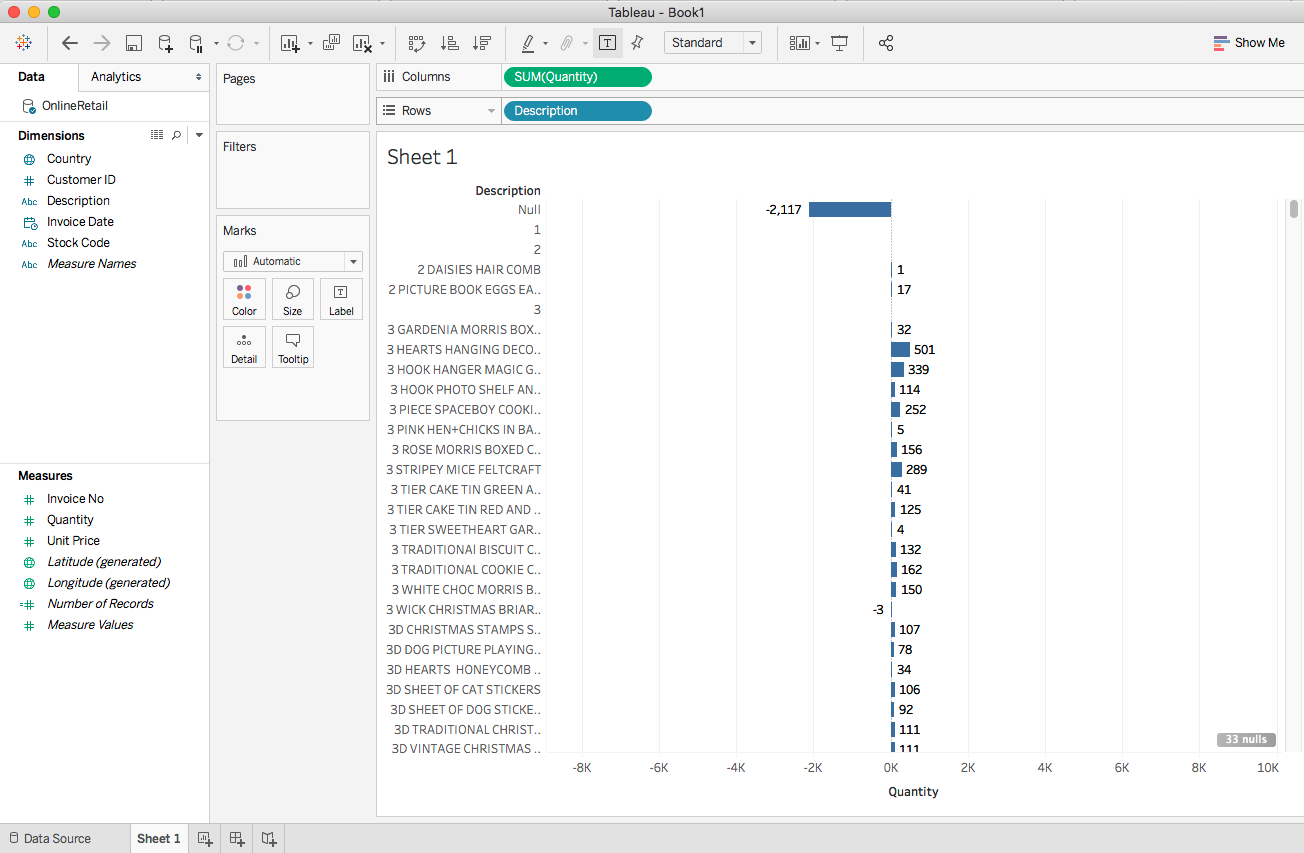
Select the Description as a row to see the bar chart showing the quantity for each item, as follows:
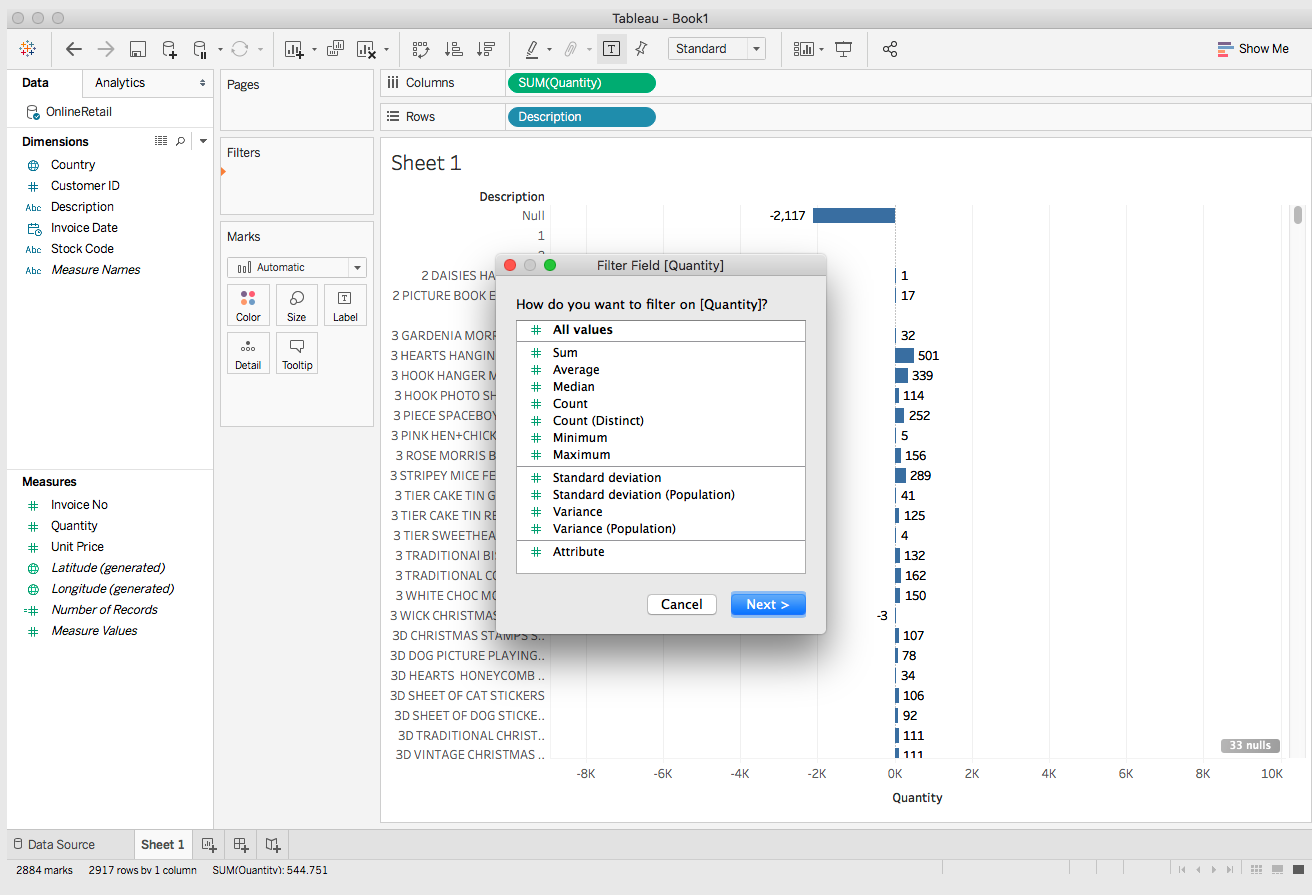
You can apply filters to eliminate the negative quantity values, as shown in this screenshot:
You will see the range of values...