d3heatmap
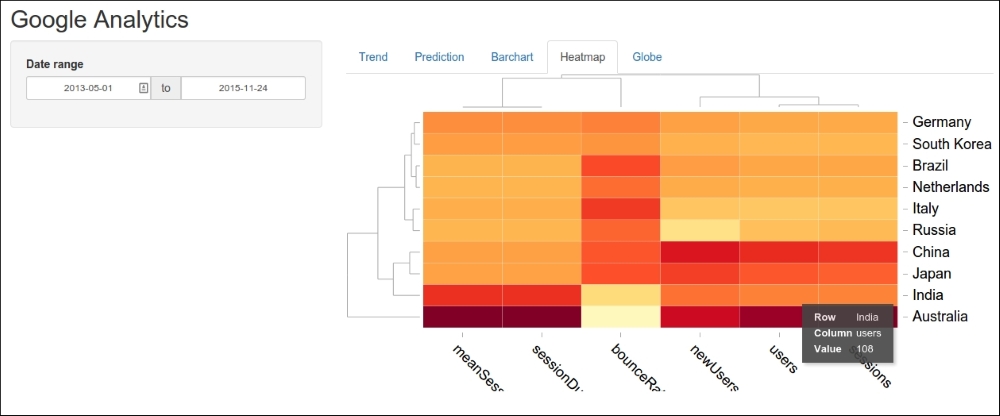
The d3heatmap package uses vanilla D3 and produces interactive heatmaps. It can be installed using install.packages("d3heatmap"). The output looks like the following screenshot:

In the preceding screenshot, several variables are plotted (arranged along the x axis) for 10 countries (arranged along the y axis). Mouseover is supported, as shown in the preceding screenshot, with the result for users in India that is highlighted (108). The code is as follows:
output$ui_heatmap <- renderUI({
  d3heatmapOutput("heatmap")
})
The first thing to note that, as discussed at the beginning of this chapter, is that it is necessary to draw the UI in a reactive context. This is because the JavaScript functions from the rCharts (NVD3) output interfere with the JavaScript (D3) from this output. Providing a reactive context for the UI ensures that this output is redrawn and allows the plot to be displayed properly. This is quite simple, as we merely need to wrap the standard d3heatmap() output function...


