Code debugging 101
Code debugging is a fundamental process of software development to uncover errors in code.
This recipe will show how to perform print debugging on an Arduino Nano and Raspberry Pi Pico by transmitting the following strings to the serial terminal:
Initialization completed: Once we have completed the initialization of the serial portExecuted: After every 2 seconds
The following Arduino sketch contains the code referred to in this recipe:
01_printf.ino:
https://github.com/PacktPublishing/TinyML-Cookbook/blob/main/Chapter02/ArduinoSketches/01_printf.ino
Getting ready
All programs are prone to bugs, and print debugging is a basic process that prints statements on the output terminal to give insight into the program execution, as shown in the following example:
int func (int func_type, int a) {
  int ret_val = 0;
  switch(func_type){
    case 0:
      printf("FUNC0\n");
      ret_val = func0(a)
      break;
    default:
      printf("FUNC1\n");
      ret_val = func1(a);
  }
  return ret_val;
}
To get ready with this first recipe, we only need to know how the microcontroller can send messages on the serial terminal.
The Arduino programming language offers a similar function to printf(), the Serial.print() function.
This function can send characters, numbers, or even binary data from the microcontroller board to our computer through the serial port, commonly called UART or USART. You can refer to https://www.arduino.cc/reference/en/language/functions/communication/serial/print/ for the complete list of input arguments.
How to do it...
Note
The code reported in this recipe is valid for both the Arduino Nano and Raspberry Pi Pico. The Arduino IDE, in fact, will compile the code accordingly with the selected platform in the device drop-down menu.
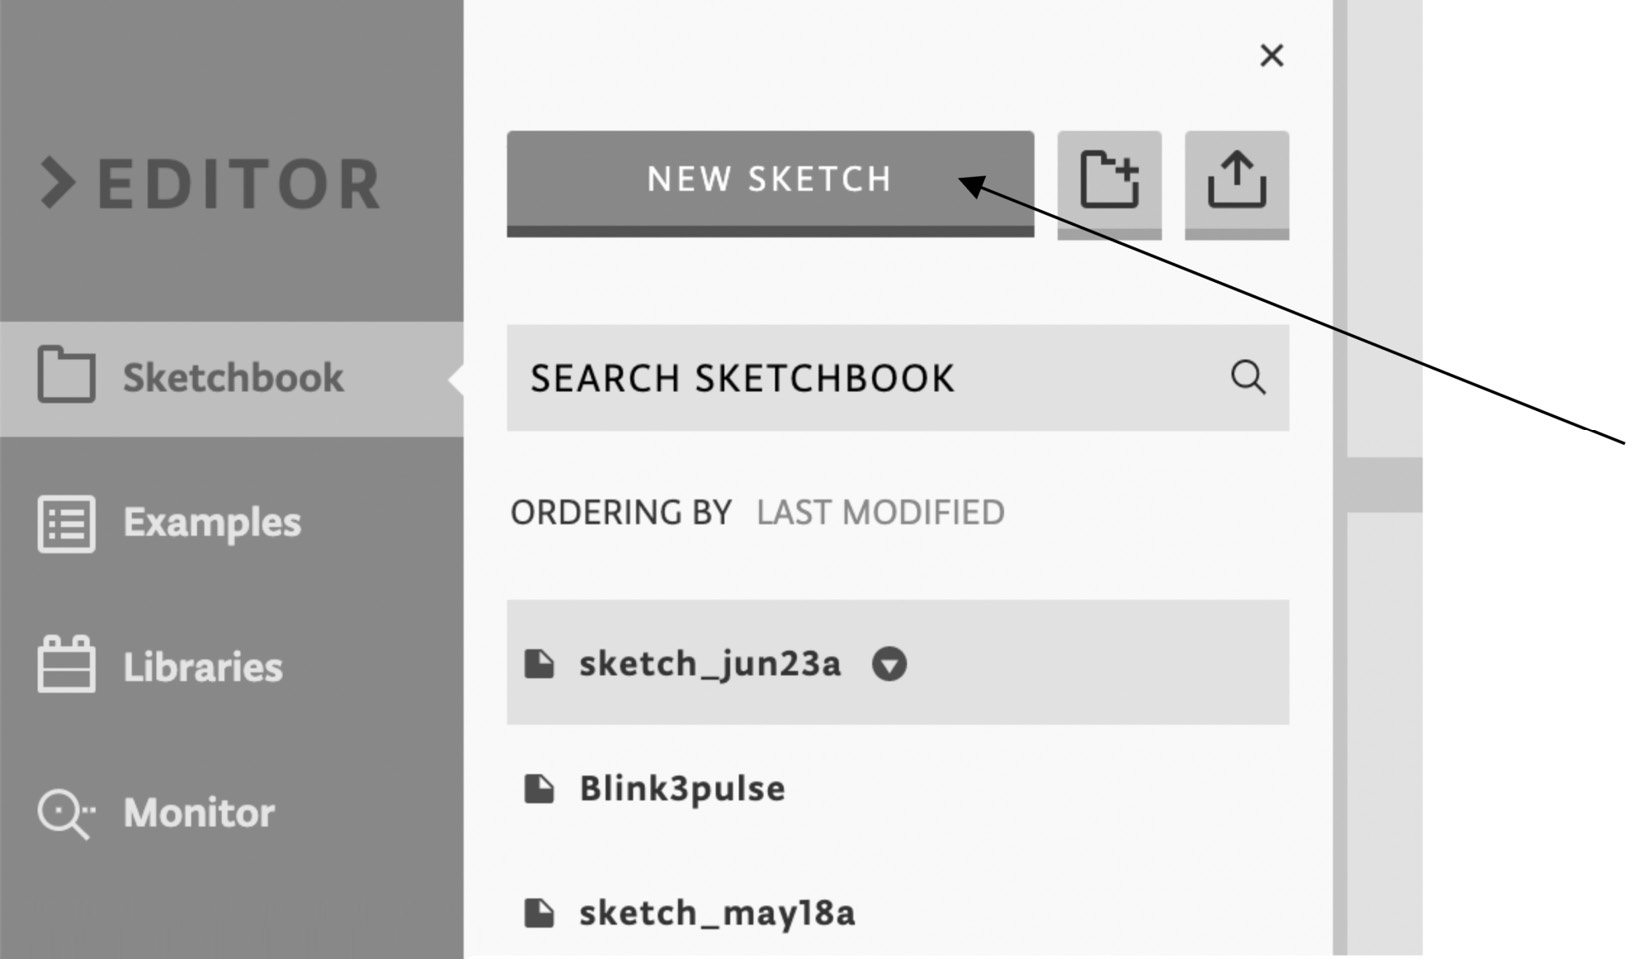
Open the Arduino IDE and create a new empty project by clicking on Sketchbook from the leftmost menu (EDITOR) and then click on NEW SKETCH, as shown in the following figure:

Figure 2.1 – Click on the NEW SKETCH button to create a new project
As we saw in Chapter 1, Getting Started with TinyML, all sketches require a file containing the setup() and loop() functions.
The following steps will show what to write in these functions to implement our print debugging recipe:
- Initialize the UART baud rate in the
setup()function and wait until the peripheral is open:void setup() { Serial.begin(9600); while (!Serial);
In contrast to the standard C library printf function, the Serial.print() function requires initialization before transmitting data. Therefore, we initialize the peripheral with the Arduino Serial.begin() function, which only requires the baud rate as an input argument. The baud rate is the data transmission rate in bits per second, and it is set to 9600 bps.
However, we can't use the peripheral immediately after the initialization because we should wait until it is ready to transmit. So, we use while(!Serial) to wait until the serial communication is open.
- Print
Initialization completedafterSerial.begin()in thesetup()function:Serial.print("Initialization completed\n"); }
We transmit the string Initialization completed with Serial.print("Initialization completed\n") to report the completion of the initialization.
- Print
Executedevery 2 seconds in theloop()function:void loop() { delay(2000); Serial.print("Executed\n"); }
Since the loop() function is called iteratively, we use the Arduino's delay() function to pause the program execution for 2 seconds. delay() accepts the amount of time in milliseconds (1 s = 1000 ms) as an input argument.
Now, make sure the device is plugged into your computer through the micro-USB cable.
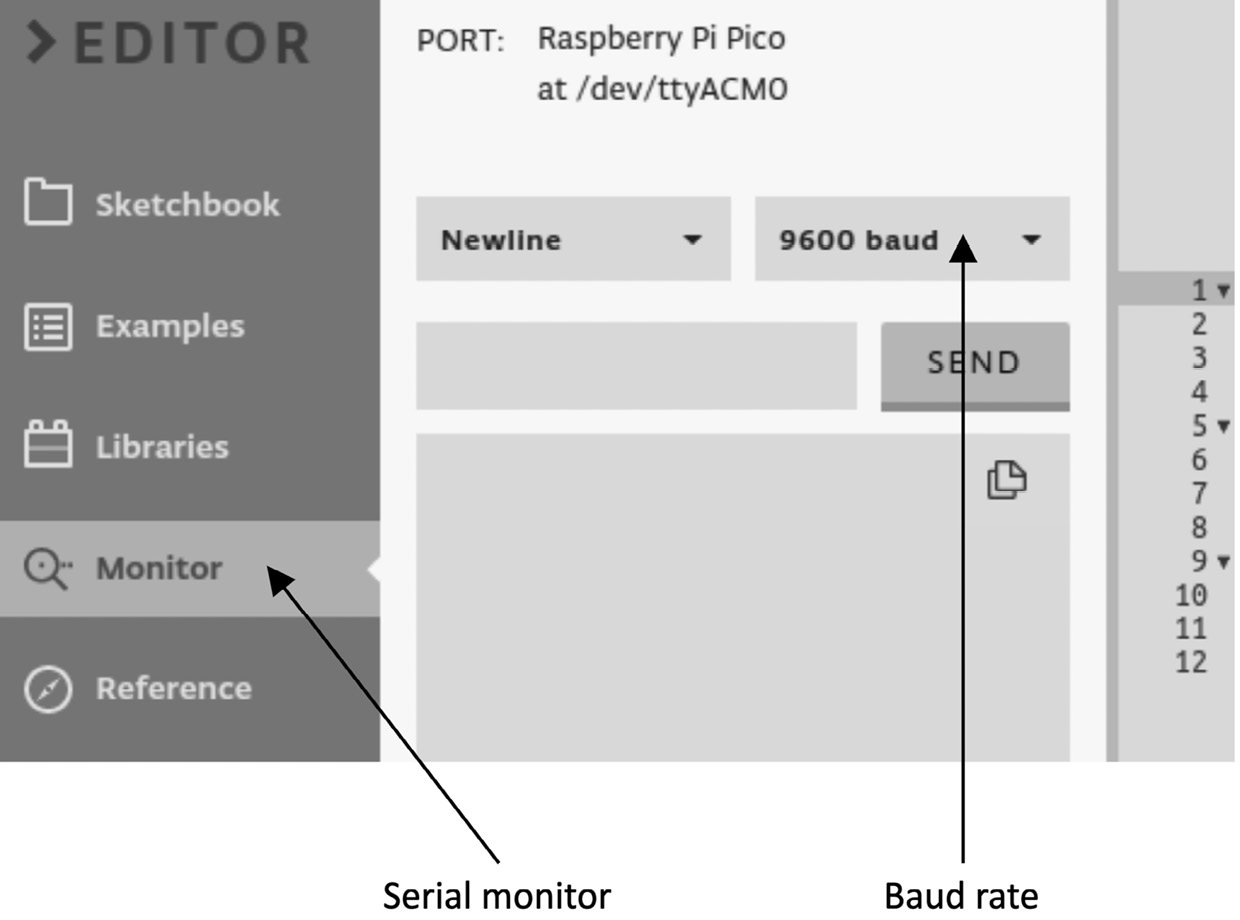
If the device is recognized, we can open the serial monitor by clicking on Monitor from the Editor menu. From there, we will see any data transmitted by the microcontroller through the UART peripheral. However, before any communication starts, ensure the serial monitor uses the same baud rate as the microcontroller peripheral (9600), as shown in the following figure:

Figure 2.2 – The serial monitor must use the same baud rate as the UART's peripheral
With the serial monitor open, we can click on the arrow near the device drop-down menu to compile and upload the program to the target platform. Once the sketch has been uploaded, the serial monitor will receive the Initialization completed and Executed messages, as shown in the following screenshot:

Figure 2.3 – Expected output on the serial monitor
As we can see from the serial monitor output, Initialization completed is printed once because the setup() function is just called when starting the program.
There's more
Print debugging is a simple debugging approach, but it has significant disadvantages with the increase of software complexity, such as the following:
- Needing to re-compile and flash the board every time we add or move
Serial.print(). Serial.print()costs in terms of program memory footprint.- We could make mistakes reporting the information (for example, using
printto report an unsignedintvariable that is actually signed).
We will not cover more advanced debugging in this book, but we recommend looking at serial wire debug (SWD) debuggers (https://developer.arm.com/architectures/cpu-architecture/debug-visibility-and-trace/coresight-architecture/serial-wire-debug) to make this process less painful. SWD is an Arm debug protocol for almost all Arm Cortex processors that you can use to flash the microcontroller, step through the code, add breakpoints, and so on with only two wires.


