From the top menu, click on Create and choose Dashboard.
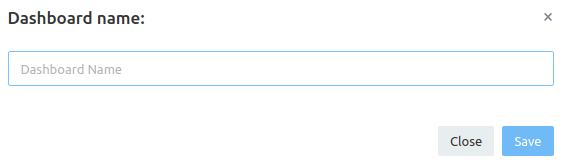
You will see a pop-up menu where you have to enter the dashboard's name (in this example, quick dashboard will be used as the dashboard's name):
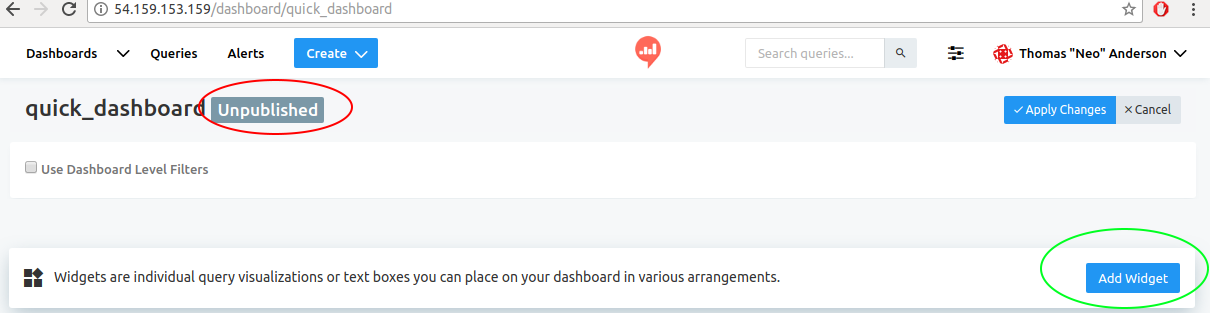
After filling in the name, you will get to a new dashboard window (which is also in an Unpublished state, meaning that only you can see it).
Click on Add Widget to start adding visualizations to this dashboard:
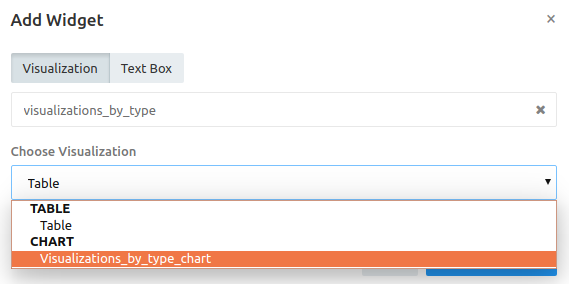
In the Add Widget window, we first need to select the query from which the results/visualizations will be taken, and afterwards we need to select the specific visualization itself (again, note that the table is also a visualization):
For this example, we add both Table and Chart, and the resulting dashboard will look like this:
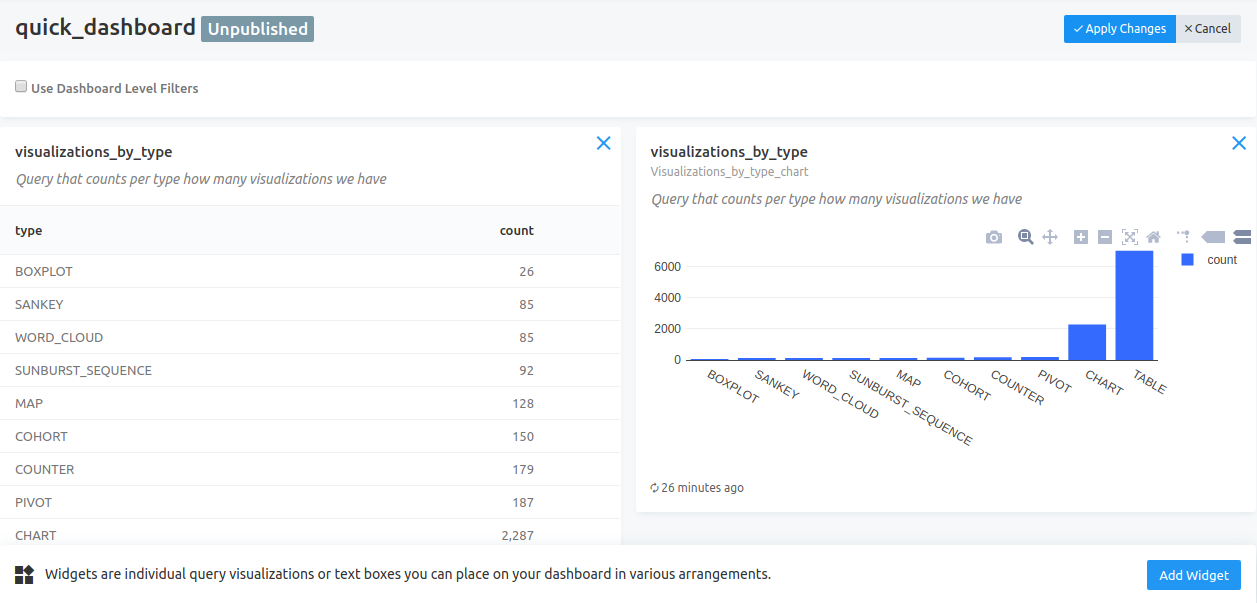
We can click on Apply Changes to save it.
Even though the dashboard is saved, it doesn't mean that everyone...