Frequency distributions
A frequency distribution is a function that gives the number of occurrences of each item of a dataset. It is like a histogram (for example, Figure 3-8). It amounts to counting the number or percentage of occurrences of each possible value.
Figure 3-20 shows the relative frequency of each of the 26 letters in English language text. For example, the letter e is the most frequent, at 13%. This information would be useful if you were producing a word game like Scrabble or if you were attempting to decipher an encoded English message.
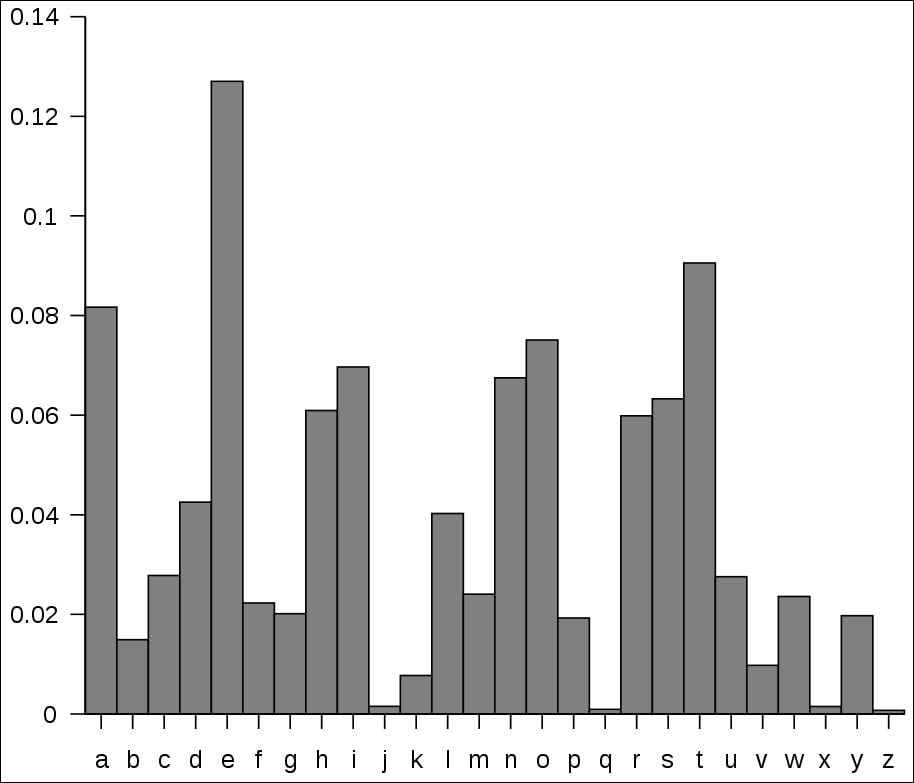
Figure 3-20. Frequency distribution of letters in English
Some frequency distributions occur naturally. One of the most common is the bell-shaped distribution that results when compiling many measurements of a single quality. It can be seen in Figure 3-21, which shows the distribution of the heights of American males, aged 25-34:

Figure 3-21. Heights of American males
In statistics, a dataset of measurements {x11, x2,..., xn} is called a sample...