Development tools
As this code comparison has shown, jQuery code is typically shorter and clearer than its basic JavaScript equivalent. However, this doesn't mean we will always write code that is free from bugs, or that we will intuitively understand what is happening on our pages at all times. Our jQuery coding experience will be much smoother with the assistance of standard development tools.
High-quality development tools are available in all modern browsers. We can feel free to use the environment that is most comfortable to us. Options include:
The Internet Explorer Developer Tools:http://msdn.microsoft.com/en-us/library/dd565628.aspx
The Safari Web Inspector :http://developer.apple.com/technologies/safari/developer-tools.html
The Chrome Developer Tools :http://code.google.com/chrome/devtools/
Firebug for Firefox: http://getfirebug.com/
Each of these toolkits offers similar development features, including:
The ability to explore and modify aspects of the DOM
Investigating the relationship between CSS and its effect on page presentation
Convenient tracing of script execution through special methods
Pausing execution of running scripts and inspecting variable values
While the details of these features vary from one browser to the next, the general concepts remain constant. In this book, some examples will require the use of one of these toolkits; we will use Firebug for these demonstrations, but development tools for other browsers are fine alternatives.
Firebug
Up-to-date instructions for installing and using Firebug can be found on the project's home page at http://getfirebug.com/. The tool is too involved to explore in great detail here, but a survey of some of the most relevant features will be useful to us.
Tip
Understanding these screenshots
Firebug is a quickly-evolving project, so the following screenshots may not exactly match your environment. Some of the labels and buttons are provided by the optional FireQuery add-on: http://firequery.binaryage.com/.
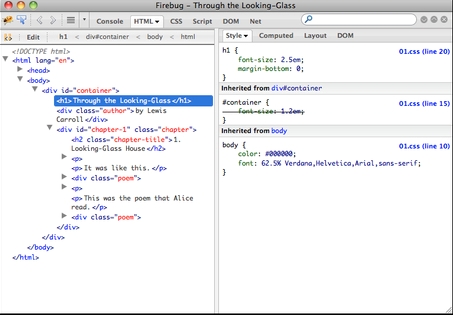
When Firebug is activated, a new panel appears offering information about the current page.
In the default HTML tab of this panel, we can see a representation of the page structure on the left side, and details of the selected element (such as the CSS rules that apply to it) on the right side. This tab is especially useful for investigating the structure of the page and debugging CSS issues, as shown in the following screenshot:

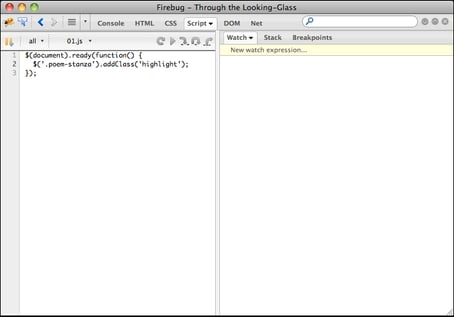
The Script tab allows us to view the contents of all loaded scripts on the page, as shown in the preceding screenshot. By clicking on a line number, we can set a breakpoint; when the script reaches a line with a breakpoint, it will pause until we resume execution with a button click. On the right side of the page, we can enter a list of variables and expressions we wish to know the value of at any time.

The Console tab will be of most frequent use to us while learning jQuery, as shown in the following screenshot. A field at the bottom of the panel allows us to enter any JavaScript statement, and the result of the statement is then presented in the panel:

In this example, we have performed the same jQuery selector as in Listing 1.2, but have not performed any action on the selected elements. Even so, the statement gives us interesting information. We see that the result of the selector is a jQuery object pointing to two .poem-stanza elements on the page. We can use this console feature to quickly try out jQuery code at any time, right from within the browser.
In addition, we can interact with this console directly from our code, using the console.log() method, as follows:
$(document).ready(function() {
  console.log('hello');
  console.log(52);
  console.log($('div.poem-stanza'));
});
Listing 1.4
This code illustrates that we can pass any kind of expression into the console.log() method. Simple values such as strings and numbers are printed directly, and more complicated values such as jQuery objects are nicely formatted for our inspection, as shown in the following screenshot:

This console.log() function (which works in each of the browser developer tools we mentioned) is a convenient alternative to the JavaScript alert() function, and will be very useful as we test our jQuery code.


