
Analyzing changes in college admissions
We can look at trends in college admissions acceptance rates over the last few years. For this analysis, I am using the data on https://www.ivywise.com/ivywise-knowledgebase/admission-statistics.
First, we read in our dataset and show the summary points, from head to validate:
df <- read.csv("Documents/acceptance-rates.csv")summary(df)head(df)
We see the summary data for school acceptance rates as follows:
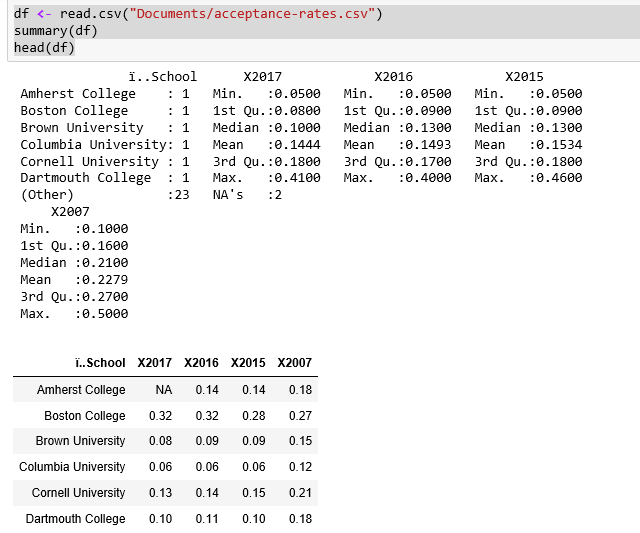
It's interesting to note that the acceptance rate varies so widely, from a low of 5 percent to a high of 41 percent in 2017.
Let us look at the data plots, again, to validate that the data points are correct:
plot(df)
From the correlation graphics shown, it does not look like we can use the data points from 2007. The graphs show a big divergence between 2007 and the other years, whereas the other three have good correlations.
So, we have 3 consecutive years of data from 25 major US universities. We can convert the data into a time series using a few steps...