Another ipywidgets linking example
We can link one of the controls to a graphic display, which I think is much more interesting.
How to do it...
We can use the following code:
%matplotlib inline
from ipywidgets import interactive
import matplotlib.pyplot as plt
import numpy as np

def f(r):
 plt.axes()
 circle = plt.Circle((0, 0), radius=r, fc='y')
 plt.gca().add_patch(circle)
 plt.axis('scaled')
 plt.show()

interactive_plot = interactive(f, r=(0.0, 1.0))
output = interactive_plot.children[-1]
output.layout.height = '350px'
interactive_plot
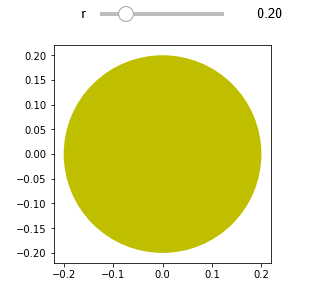
The display looks like is:

How it works...
Changing the position of the slide bar changes the value of the slide bar. The new value of the slide bar is used to repaint the circle image using the slide bar value as the radius of the circle.
Just as we saw in the previous linking example, the underlying code is attaching an event listener (the f function we defined just now) to the slide bar. When the value of the slide bar changes, it calls upon the event handler...


