


ARCH/GARCH
When the variance of a dataset is not constant over time, ARIMA models face problems with modeling it. In economics and finance, in particular, this can be common. In a financial time series, large returns tend to be followed by large returns and small returns tend to be followed by small returns. The former is called high volatility, and the latter low volatility.
Autoregressive Conditional Heteroscedasticity (ARCH) models were developed to solve this problem. Heteroscedasticity is a fancy way of saying that the variance or spread of the data is not constant throughout, with the opposite term being homoscedasticity. The difference is visualized here:
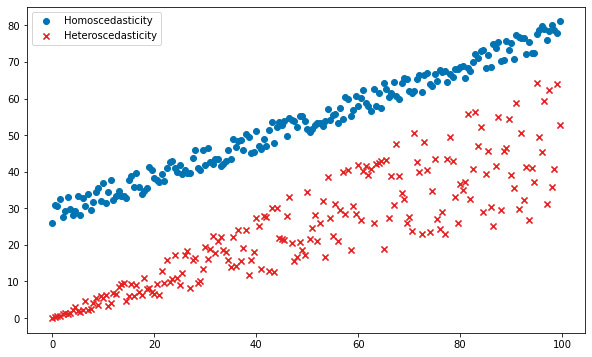
Figure 1.3 – Scedasticity
Robert Engle introduced the first ARCH model in 1982 by describing the conditional variance as a function of previous values. For example, there is a lot more uncertainty about daytime electricity usage than there is about nighttime usage. In a model of electricity usage, then, we might assume that the daytime hours have a particular variance, and usage during the night would have a lower variance.
Tim Bollerslev and Stephen Taylor introduced a moving average component to the model in 1986 with their Generalized ARCH model, or GARCH. In the electricity example, the variance in usage was a function of time of day. But perhaps the swings in volatility don't necessarily occur at specific times of the day, but the swings are themselves random. This is when GARCH is useful.
Both ARCH and GARCH models can handle neither trend nor seasonality though, so often, in practice, an ARIMA model may first be built to extract out the seasonal variation and trend of a time series, and then an ARCH model may be used to model the expected variance.


