
In this section, we will discuss stories. In order to create a story, you must have created at least one sheet. A story is a blank page where you can combine sheets with text and other objects. You create multiple story points and present them one after another to tell a story with the data. Stories are an excellent way to share the findings of your analysis. To create a story, click the New Story button at the bottom of the workbook. The Story tab is available at the bottom of the workbook:

Once you have clicked on the New Story button (bottom of the workbook), a blank story page will open. A story is a collection of visualizations presented in an ordered format. A story is similar to a PowerPoint presentation. The story comprises a series of story points. The following screenshot shows a blank story page:
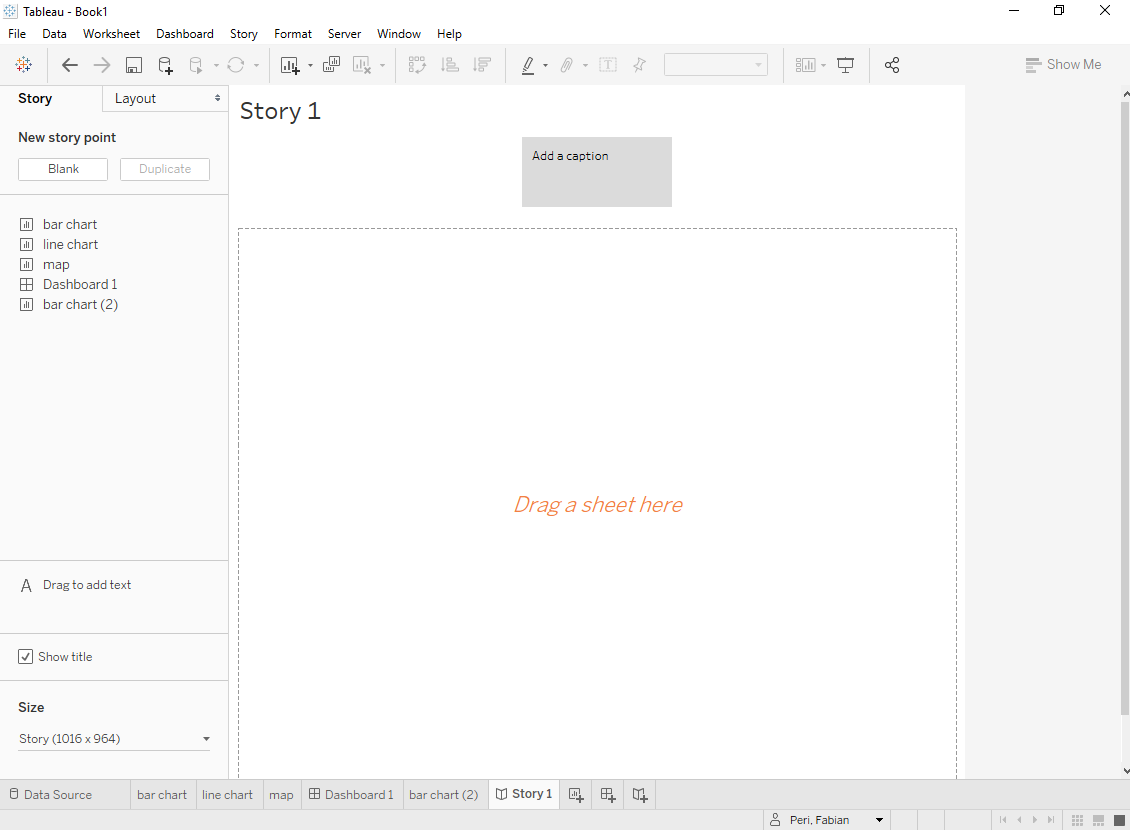
There are two tabs in the menu on the left-hand side...