Configuring gauges
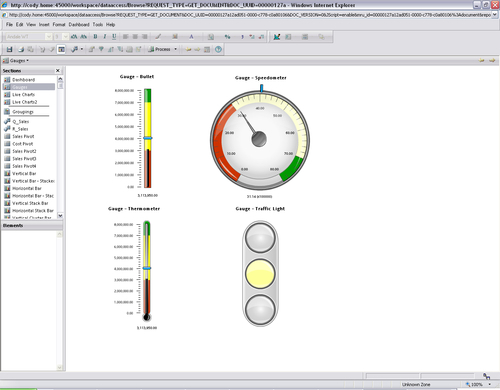
When a gauge is added to a dashboard, the gauge must be populated with data elements from a Query section, and the properties of the gauge can be configured to produce the desired view of interest. The following image is a sample of each of the four gauges on a dashboard:

Each gauge contains a Fact element and all of the gauges besides the Traffic Light contain a Target Fact element. When a gauge is clicked and highlighted on the dashboard during design, a Data Layout window appears at the bottom of the main screen with areas to add data elements from Query results or a table. Dragging-and-dropping the desired elements from the Elements window into the Data Layout area will configure and populate the object with data. After adding the elements to the section, making the dashboard active will display the populated object.
When viewing the gauges (other than the Traffic Light), notice the gauges show the Fact in either the black line or speedometer needle and the Target...


