SQL Trace
SQL Trace is a SQL Server feature you can use to troubleshoot performance issues. It has been available since the early versions of SQL Server, so it is well-known by database developers and administrators. However, as noted in the previous chapter, SQL Trace has been deprecated as of SQL Server 2012, and Microsoft recommends using extended events instead.
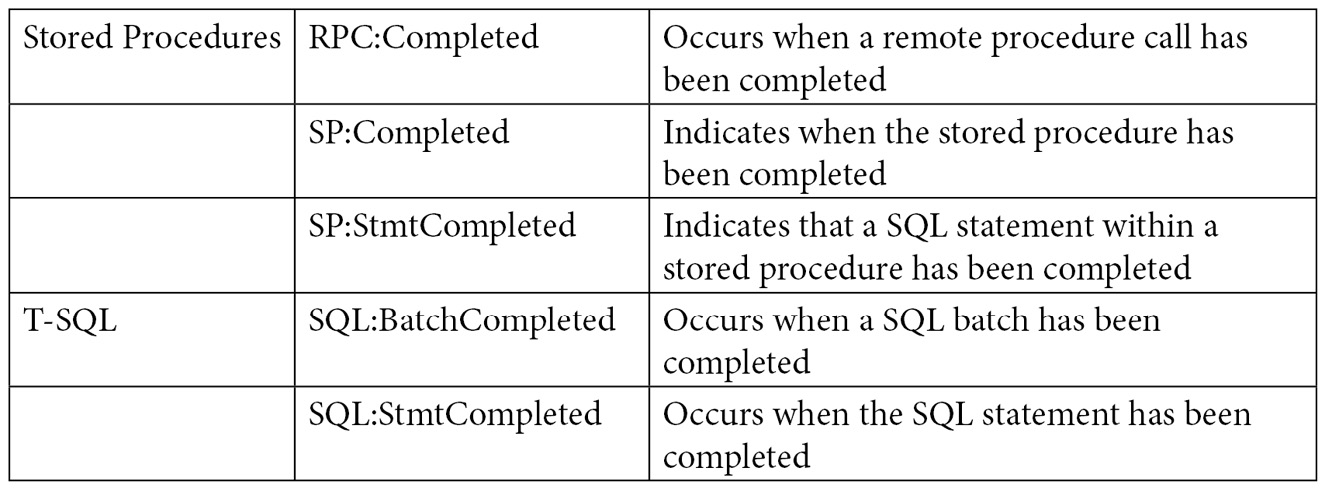
Although you can trace dozens of events using SQL Trace, in this section, we will focus on the ones you can use to measure query resource usage. Because running a trace can take some resources itself, usually, you would only want to run it when you are troubleshooting a query problem, instead of running it all the time. Here are the main trace events we are concerned with regarding query resources usage:

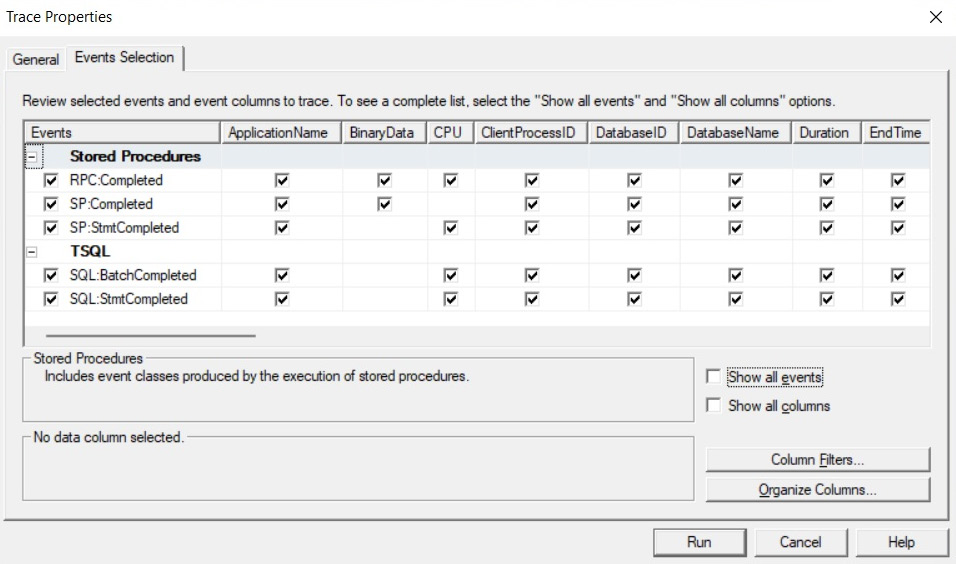
The following screenshot shows an example of such a trace configuration on SQL Server Profiler. Usually, you would want to use Profiler to run the trace for a very short time. If you need to run the trace for, say, hours or a few days, a server trace may be a better choice because it uses fewer resources. The previous chapter showed how you can use Profiler to script and run a server trace:

Figure 2.1 – Trace configuration using SQL Server Profiler
Now, let’s see how it works. Run Profiler and select the previous five listed events. Run the trace and then execute the following ad hoc query in Management Studio:
SELECT * FROM Sales.SalesOrderDetail WHERE SalesOrderID = 60677
This query execution will trigger the following events:
SQL:StmtCompleted. SELECT * FROM Sales.SalesOrderDetail WHERE SalesOrderID = 60677
SQL:BatchCompleted. SELECT * FROM Sales.SalesOrderDetail WHERE SalesOrderID = 60677
You could look for ApplicationName under Microsoft SQL Server Management Studio – Query in case you see more events. You may also consider filtering by SPID using Profiler’s filtering capabilities.
Now, let’s say we create and execute the same query as part of a simple stored procedure, like so:
CREATE PROC test
AS
SELECT * FROM HumanResources.Employee WHERE BusinessEntityID = 229
Let’s run it:
EXEC test
Here, we would hit the following events:
SP:StmtCompleted. SELECT * FROM HumanResources.Employee WHERE BusinessEntityID = 229
SP:Completed. SELECT * FROM HumanResources.Employee WHERE BusinessEntityID = 229
SP:Completed. EXEC test
SQL:StmtCompleted. EXEC test
SQL:BatchCompleted. EXEC test
Only the first three events are related to the execution of the stored procedure per se. The last two events are related to the execution of the batch with the EXEC statement.
So, when would we see an RPC:Completed event? For this, we need a remote procedure call (for example, using a .NET application). For this test, we will use the C# code given in the C# Code for RPS Test sidebar. Compile the code and run the created executable file. Because we are calling a stored procedure inside the C# code, we will have the following events:
SP:Completed. SELECT * FROM HumanResources.Employee WHERE BusinessEntityID = 229
SP:StmtCompleted. SELECT * FROM HumanResources.Employee WHERE BusinessEntityID = 229
SP:Completed. exec dbo.test
RPC:Completed. exec dbo.test
Again, you can look for ApplicationName under .Net SqlClient Data Provider in Profiler in case you see additional events:
C# Code for RPC Test
Although looking at .NET code is outside the scope of this book, you can use the following code for the test:
using System;
using System.Data;
using System.Data.SqlClient;
class Test
{
static void Main()
{
SqlConnection cnn = null;
SqlDataReader reader = null;
try
{
cnn = new SqlConnection("Data Source=(local);
Initial Catalog=AdventureWorks2019;Integrated
Security=SSPI");
SqlCommand cmd = new SqlCommand();
cmd.Connection = cnn;
cmd.CommandText = "dbo.test";
cmd.CommandType = CommandType.StoredProcedure;
cnn.Open();
reader = cmd.ExecuteReader();
while (reader.Read())
{
Console.WriteLine(reader[0]);
}
return;
}
catch (Exception e)
{
throw e;
}
finally
{
if (cnn != null)
{
if (cnn.State != ConnectionState.Closed)
cnn.Close();
}
}
}
}
To compile the C# code, run the following in a command prompt window:
csc test.cs
You don’t need Visual Studio installed, just Microsoft .NET Framework, which is required to install SQL Server, so it will already be available on your system. You may need to find the CSC executable, though, if it is not included on the system’s PATH, although it is usually inside the C:\Windows\Microsoft.NET directory. You may also need to edit the used connection string, which assumes you are connecting to a default instance of SQL Server using Windows authentication.


