Generating a histogram using Python
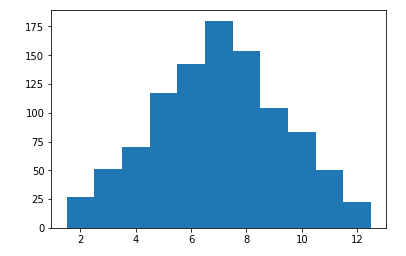
In this example, we generate a histogram of random numbers. In this case, we are simulating rolling dice 1,000 times and recording the resultant face value.
How to do it...
We can use this Python script:
import pylab
import random

random.seed(113)

samples = 1000
dice = []
for i in range(samples):
 total = random.randint(1,6) + random.randint(1,6)
 dice.append(total)

pylab.hist(dice, bins= pylab.arange(1.5,12.6,1.0))
pylab.show()
This results in a histogram display:

This is the graph showing almost exactly what we expected. I imagine that with a higher cycle count, we would have got closer to a pure pyramid peaking at 7.
How it works...
For the histogram, we use the pylab library. We also use the random library to simulate the dice rolls.
We first set the random seed to a fixed value. This allows you to reproduce the results I have shown exactly.
Next, we simulate rolling the dice 1,000 times and record the results in an array. In this case, we are just recording...


