Search icon CANCEL
Subscription
0
Cart icon
Close icon
You have no products in your basket yet
Save more on your purchases!
Savings automatically calculated. No voucher code required
Arrow left icon
All Products
Best Sellers
New Releases
Books
Videos
Audiobooks
Learning Hub
Newsletters
Free Learning
Arrow right icon
Hands-On Time Series Analysis with R

You're reading from  Hands-On Time Series Analysis with R

Product type Book
Published in May 2019
Publisher Packt
ISBN-13 9781788629157
Pages 448 pages
Edition 1st Edition
Languages
Author (1):
Rami Krispin Rami Krispin
Profile icon Rami Krispin

Table of Contents (14) Chapters

Preface 1. Introduction to Time Series Analysis and R 2. Working with Date and Time Objects 3. The Time Series Object 4. Working with zoo and xts Objects 5. Decomposition of Time Series Data 6. Seasonality Analysis 7. Correlation Analysis 8. Forecasting Strategies 9. Forecasting with Linear Regression 10. Forecasting with Exponential Smoothing Models 11. Forecasting with ARIMA Models 12. Forecasting with Machine Learning Models 13. Other Books You May Enjoy

Time series analysis

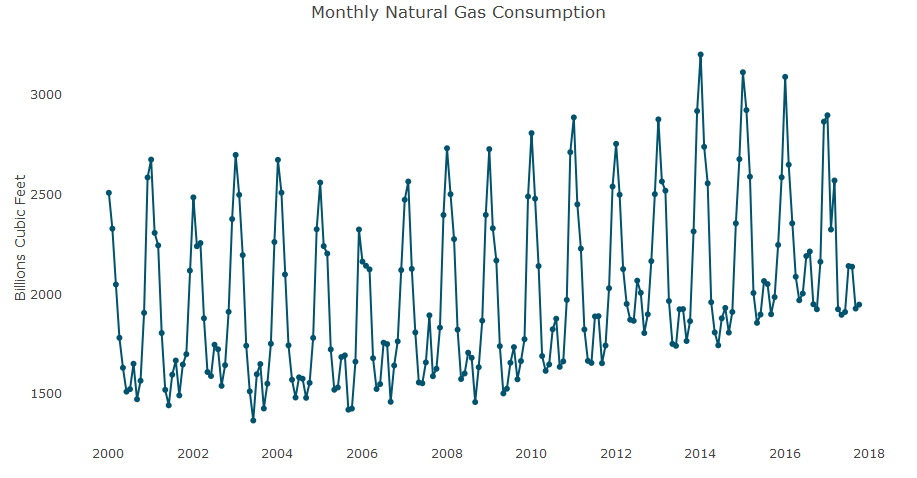
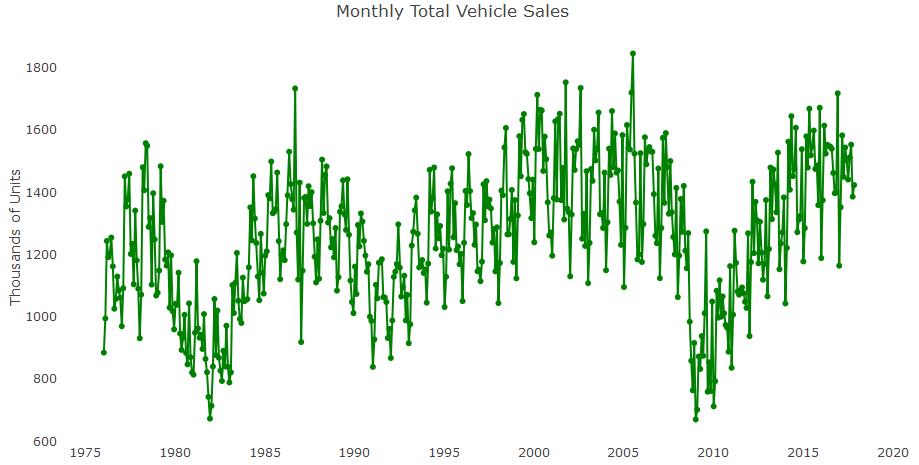
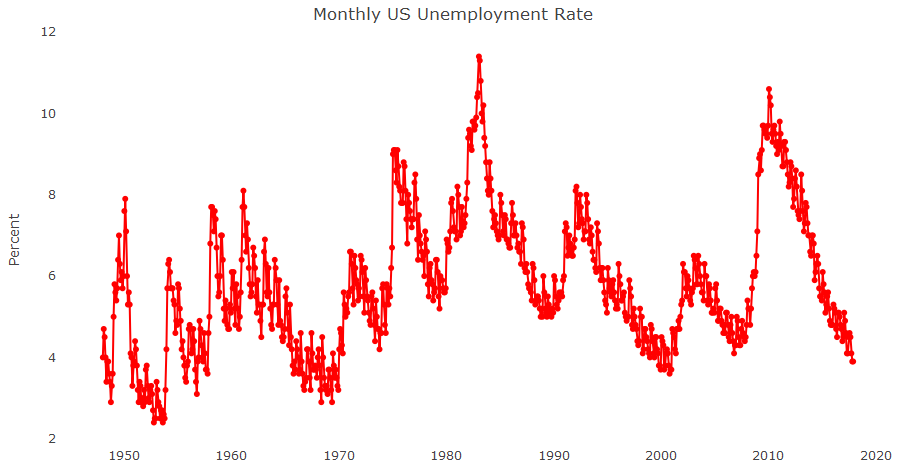
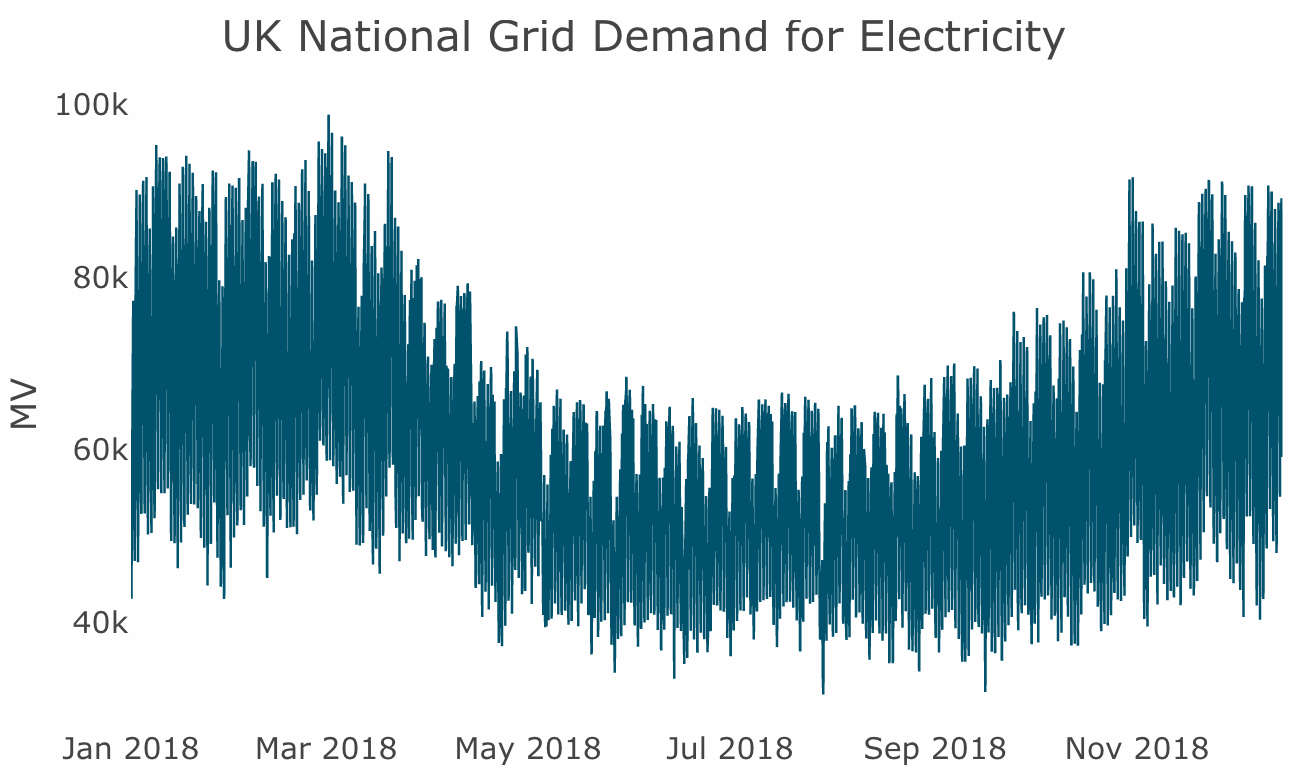
Time series analysis is the process of extracting meaningful insights from time series data with the use of data visualization tools, statistical applications, and mathematical models. Those insights can be used to learn and explore past events and to forecast future events. The analysis process can be divided into the following steps:

  1. Data collection: This step includes extracting data from different data sources, such as flat files (such as CSV, TXT, and XLMS), databases (for example, SQL Server, and Teradata), or other internet sources (such as academic resources and the Bureau of Statistics datasets). Later on in this chapter, we will learn how to load data to R from different sources.
  2. Data preparation: In most cases, raw data is unstructured and may require cleaning, transformation, aggregation, and reformatting. In Chapter 2, Working with Date and Time Objects; Chapter 3, The Time Series Object; and Chapter 4, Working with zoo and xts Objects, we will focus on the core data preparation methods of time series data with R.
  3. Descriptive analysis: This is used in summary statistics and data visualization tools to extract insights from the data, such as patterns, distributions, cycles, and relationships with other drivers to learn more about past events. In Chapter 5, Decomposition of Time Series Data; Chapter 6, Seasonality Analysis; and Chapter 7, Correlation Analysis, we will focus on descriptive analysis methods of time series data.
  4. Predictive analysis: We use this to apply statistical methods in order to forecast future events. Chapter 8, Forecasting Strategies; Chapter 9, Forecasting with Linear Regression; Chapter 10, Forecasting with Exponential Smoothing Models; Chapter 11, Forecasting with ARIMA Models; and Chapter 12, Forecasting with Machine Learning Models, we will focus on traditional forecasting approaches (such as linear regression, exponential smoothing, and ARIMA models), as well as advanced forecasting approaches with machine learning models.

It may be surprising but, in reality, the first two steps may take most of the process time and effort, which is mainly due to data challenges and complexity. For instance, companies tend to restructure their business units (BU) and IT systems every couple of years, and therefore it is hard to identify and track the historical contribution (production, revenues, unit sales, and so on) of a specific BU before the changes.

In other cases, additional effort is required to clean the raw data and handle missing values and outliers. This sadly leaves less time for the analysis itself. Fortunately, R has a variety of wonderful applications for data preparations, visualizations, and time series modeling. This helps to reduce the time that's spent on the preparation steps and lets you allocate more time to the analysis itself. Throughout the rest of this chapter, we will provide background information on R and its applications for time series analysis.

Learning with real-life examples

Throughout the learning journey in this book, we will use real-life examples of time series data in order to apply the methods and techniques of the analysis. All of the datasets that we will use are available in the TSstudio and UKgrid packages (unless stated otherwise).

The first time series data we will look at is the monthly natural gas consumption in the US. This data is collected by the US Energy Information Administration (EIA) and measures the monthly natural gas consumption from January 2000 until November 2018. The unit of measurement is billions of cubic feet (not seasonally adjusted). The following graph shows the monthly natural gas consumption in the US:

The following series describe the total vehicle sales in the US from January 1976 until January 2019. The units of this series are in thousands of units (not seasonally adjusted). The data is sourced from the US Bureau of Economic Analysis. The following graph shows the total monthly vehicle sales in the US:

Another monthly series that we will use is the monthly US unemployment rate, which represents the number of unemployed as a percentage of the labor force. The series started in January 1948 and ended in January 2019. The data is sourced from the US Bureau of Labor Statistics. The following graph shows the monthly unemployment rate in the US:

Last but not the least, we will use the national demand for electricity in the UK (as measured on the grid systems) between 2011 and 2018, since it provides an example of high-frequency time series data with half-hourly intervals. The data source is the UK National Grid website, and the information is shown in the following graph:

Let's start by installing R.

You have been reading a chapter from
Hands-On Time Series Analysis with R
Published in: May 2019 Publisher: Packt ISBN-13: 9781788629157
Register for a free Packt account to unlock a world of extra content!
A free Packt account unlocks extra newsletters, articles, discounted offers, and much more. Start advancing your knowledge today.
Unlock this book and the full library FREE for 7 days
Get unlimited access to 7000+ expert-authored eBooks and videos courses covering every tech area you can think of
Renews at €14.99/month. Cancel anytime}